
Azure Traffic Analytics and NSG flow logs are one of Azure’s best kept secrets. In short, you can log every single network flow going through your Network Security Groups (NSGs), including the number of packets and its ingress/egress bandwidth. Traffic Analytics already makes a great job at showing interesting stuff: the scenarios documented in the docs are finding traffic hot spots, visualizing traffic per geography or virtual network, identifying virtual machines receiving traffic from the Internet, or viewing NSG rule hits. But there is so much more you can do with this data.
Being able to log every single packet and running high-performance analytics on those logs can have an immense value for an organization, which Traffic Analytics only starts tapping into. Here two examples I frequently hear:
- I have a wide-open network today, but I want to start locking down my NSGs. Azure Security Center Adaptive Network Hardening would help you there in many use cases, but for others (for example, Adaptive Network Hardening does not support every single TCP/UDP port), you might want to have a look at the ports that a certain VM is getting traffic on
- How do I identify anomalies in my network, that could be due to application pattern changes, or to security breaches performing some exploration or even data exfiltration?
NOTE: The following screenshots in this post are taken out of an Azure Monitor Workbook that you can find saved here in JSON format. And if you want a script that creates a bunch of VMs and generates some traffic between them, you can try this one.
For the first use case, you can use some relatively simple KQL queries to find out on which ports a certain VM is receiving traffic, for example:
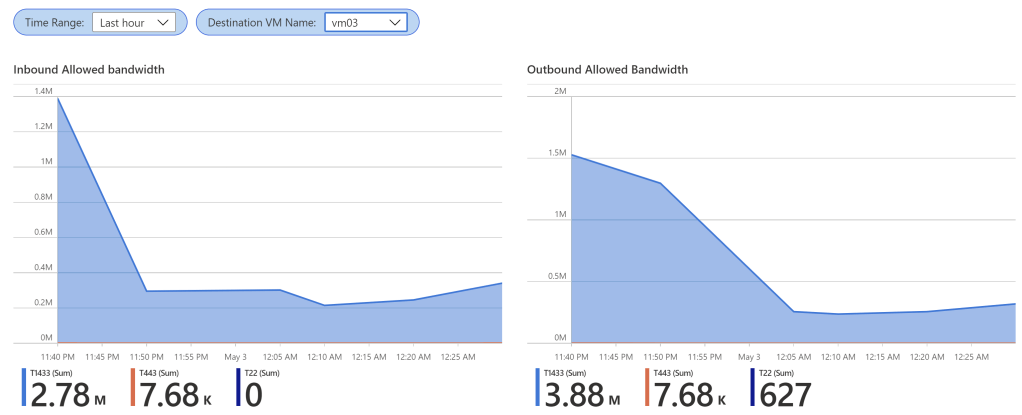
In this example, vm03 seems to be getting traffic on ports 443 and 1433, and some minor 22. Note that it is important examining a relatively extended period of time, since some traffic patterns might only occur occasionally. This would allow you to start closing the NSGs applied to vm03. The next step would be having a closer look at who is accessing those ports, for example with some queries that give you the actual IP addresses for inbound and outbound flows (in this example, summarizing Azure/External IPs):

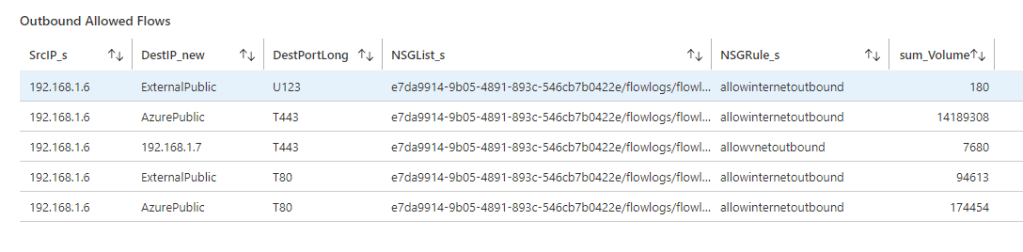
The workbook offers filtering per NSG rule at the beginning of the page, so that if you have a permit any rule at the bottom of the NSG, you can restrict the charts to the traffic you haven’t categorized yet with explicit rules.
Let’s move on now to the second use case, since it is more interesting and trickier: detecting traffic anomalies. What is an anomaly? We could think of it as a deviation from the normal, or average. For example, these charts represent the total amount of ingress and egress bandwidth:
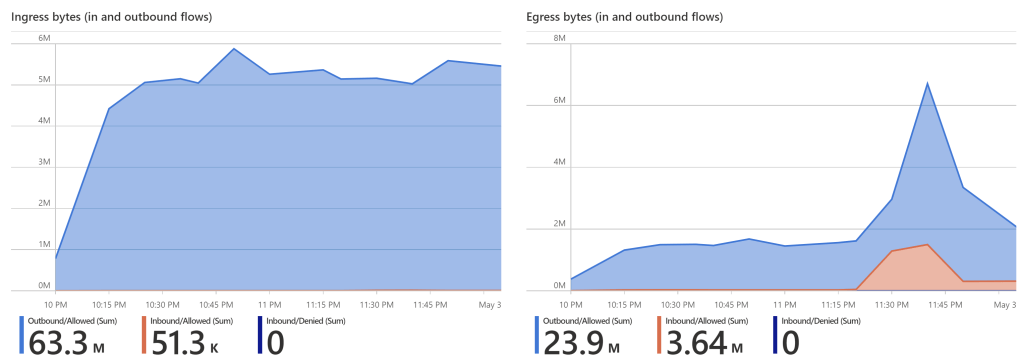
It seems clear that there has been some kind of anomaly at around 11:30PM. What was it? An additional look into our NSG Flow Logs can give us some hints. For example, aggregating data per source VM and destination port, it seems clear that the incident is mainly impacting vm01 and TCP port 1433:
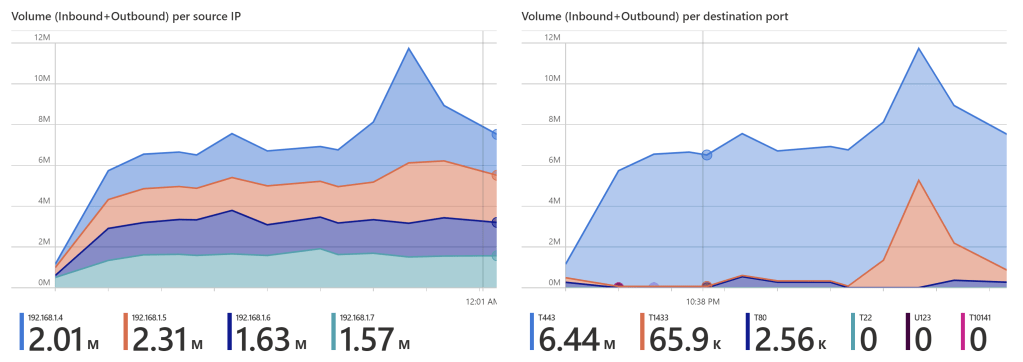
How could you have found out if instead of having 4 VMs as in this example you would have had hundreds? Visually inspecting charts might not be the most effective way, so here come statistics to the rescue. You could do some more sophisticated queries that calculate the average bandwidth per source VM and destination port over a certain range, and then measure the deviation from that average. You could normalize it to the average, so that anomalies in small-bandwidth protocols don’t disappear in the noise. Something like this:
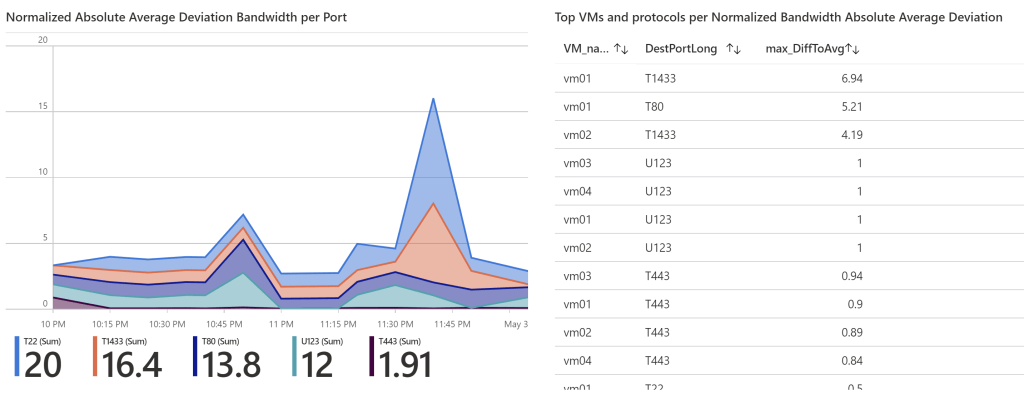
Looking at the table on the right hand side, we can see that effectively vm01 has seen a substantial increase in traffic for TCP ports 1433 (almost 7 times its average) and 80 (5 times its average). Now you have enough information to start researching whether this actually represents a security breach, or if there is another more benevolent explanation.
Summary
Logging your network traffic into an analytics platform such as Azure Monitor can give you a wealth of actionable information, for example to improve your security posture or to reduce the time it takes you to detect security breaches.

[…] time ago I blogged here about how to extract additional insights from data in Traffic Analytics, one of my favorite Azure […]
LikeLike
[…] time ago I blogged here about how to extract additional insights from data in Traffic Analytics, one of my favorite Azure […]
LikeLike
[…] time ago I blogged here about how to extract additional insights from data in Traffic Analytics, one of my favorite Azure […]
LikeLike
[…] is just awesome, as I have written in other blog posts (here for Firewall+NSG log analysis, or here for custom breach detection): it enriches the information of NSG FLow Logs with IP reputation (to […]
LikeLike
[…] my blog, you are probably familiar with Flow Logs. Back in the day I blogged about how to use NSG Flow Logs to detect traffic anomalies, about different ways to access NSG Flow Logs, and more recently about the main functional […]
LikeLike