
Update: as Srinivas describes in the comments, ingesting Flow Logs with Azure Data Explorer may lead to duplicate records.
In every network you want to know what traffic is using it. Networking devices offer multiple options to report on traffic, such as Netflow, sFlow or IPFIX. However, these options are often not available in public clouds. For example, in Azure the next closest thing are NSG Flow Logs, which you can enable in your NSGs to get all traffic coming in or out of a virtual machine.
When you configure NSG Flow Logs, you have a couple of options for analyzing its data:
- At the bare minimum, you will be sending your NSG Flow Logs to a storage account.
- Optionally, you can additionally send traffic to Traffic Analytics, part of Network Watcher. This is definitely the easiest option to configure.
Traffic Analytics is just awesome, as I have written in other blog posts (here for Firewall+NSG log analysis, or here for custom breach detection): it enriches the information of NSG FLow Logs with IP reputation (to see whether you have traffic from malicious addresses), it offers many out-of-the-box queries such as Top Talkers, and you can build your own Kusto queries to dive deeper in the data. However, in certain situations the value that Traffic Analytics provides doesn’t justify its cost (see Network Watcher pricing for more details on exact prices), especially when there are tons of NSG Flow Logs flowing into it.
In this post I will briefly explain 4 options to get to your NSG Flow Logs data, alternative to Traffic Analytics. Before you try any of these, be sure to consider Traffic Analytics for your NSG Flow Logs, since it will definitely be the easiest to use:
- Directly accessing logs in Azure Storage: using a Python script, you can extract the latest flow logs for troubleshooting. No analytics or complex queries though!
- Power BI: probably the easiest after Traffic Analytics, it offers you the magic of the best business intelligence solution out there. With a little bit of extra config to support the v2 Flow Log format, you will be up and running in no time
- Azure Data Explorer: the power of Kusto in your own cluster. We will explore a scenario which is not documented (yet), and although a bit complex to set up, offers a very attractive value proposition
- Elastic: and all the good things you love about Elastic, if you are using it already! Here we will see an alternative implementation to the documented process, since it is using a deprecated logstash ingestion plugin
Direct access to Flow Logs in Azure Storage
This is definitely your cheapest option to access NSG Flow Logs, and it might be a good one for certain cases. More specifically, when you need your logs only for troubleshooting with as less latency as possible. Essentially, you only need to see the latest logs, and not run queries across thousands of them.
I wasn’t aware of such a tool, so some time ago I developed a Python script that accesses the latest flow logs in a given Azure Storage account, and applies some optional filters to output only certain types of logs: only dropped packets, the flows containing a certain IP address, excluding the Azure Load Balancer IP, etc. You can find that script, as well as instructions on how to use it, here.
However, this is not news (I have blogged about this in the past), plus this approach doesn’t offer any capability of running any data analysis, such as identifying the Top Talkers. Let’s move on to more interesting topics.
PowerBI
PowerBI is Microsoft’s business intelligence tool, which offers a good number of graphical tools to extract insights from data. You don’t need to believe me, you can check Gartner’s 2023 Magic Quadrant for Analytics and BI Platforms.
Documented in Visualizing Azure NSG flow logs – Power BI – Azure Network Watcher | Microsoft Learn, the process to import NSG Flow Log data into Power BI and create a sample dashboard is very easy to follow, leveraging a Power BI template that can be used to create the Power Query and the dashboard in the Power BI desktop application, which can then export it to the Power BI web portal.
The template referenced in the documentation extracts the fields present in v1 flow logs, however the DAX query provided in the Power BI template can be easily enhanced to look at the additional fields of v2 (state and packet/byte counters).
Consequently, the dashboard provided by the Power BI template doesn’t contain these v2 fields either, but it is relatively simple building new visualizations for those fields.
Especially if your organization already owns Power BI licenses, this approach might be very convenient. You would only incur into the costs derived of extracting the information out of Azure Storage (storage read operations and egress bandwidth), you can refer to Power BI and Azure egress – Power BI | Microsoft Learn for more information on these egress costs.
Azure Data Explorer
Another possibility for analyzing data without leaving Azure is Azure Data Explorer (ADX). You can look at ADX as your own private version of Log Analytics. Once you create a cluster, you can use it, fill it with data and query it as you see fit, while only paying for the cost of the cluster. In other words, it offers similar functionality to Azure Log Analytics, but with a different pricing model that might make it more attractive. For example, check this blog post by Guillaume Beaud on a similar use case of ADX for Azure Firewall.
Azure Data Explorer can grab data from many different sources, including Azure Storage (more information in Create an Event Grid data connection for Azure Data Explorer). The exact configuration process for NSG Flow Logs is not documented, hence I will go into a bit more detail here. After creating an Azure Data Explorer cluster with a database (see Quickstart: Create an Azure Data Explorer cluster and database), a new table needs to be created in your ADX database. You can log into your new cluster and run queries such as this one using the Data Explorer UI:
// Create table to receive raw logs from Azure Storage (over Event Grid)
.create table ['rawFlowLogs']  (['records']:dynamic, ['EventProcessedUtcTime']:datetime, ['PartitionId']:int, ['EventEnqueuedUtcTime']:datetime)
Raw flow logs will be imported into the table we just created. Now we need a “pipeline” to convert the native JSON format of NSG Flow Logs into structured records for another table. Such a pipeline can be created with this query:
// Create Mapping function (NSG Flow Logs)
.create-or-alter function
with (docstring = 'Parses raw flowlogs records into strongly-typed columns', folder = 'FlowLogs')
FlowLogMapping() {
    rawFlowLogs
    | mv-expand records = records
    | take 1
    | project   Time = todatetime(records["time"]),
                macAddress = tostring(records["macAddress"]),
                category = tostring(records["category"]),
                flowLogVersion = toint(records["properties"]["Version"]),
                nsgResourceID = tostring(records["resourceId"]),
                flows = todynamic(records["properties"]["flows"])
    | mv-expand flows
    | extend rule = tostring(flows["rule"])
    | extend flowsFlows = todynamic(flows["flows"])
    | mv-expand flowsFlows
    | extend macAddress2=tostring(flowsFlows["mac"]),
             flowsFlowsTuples = todynamic(flowsFlows["flowTuples"])
    | mv-expand flowsFlowsTuples
    | extend fields = split(flowsFlowsTuples, ',')
    | extend Timestamp = tostring(fields[0]),
             srcIP = tostring(fields[1]),
             dstIP = tostring(fields[2]),
             srcPort = tostring(fields[3]),
             dstPort = tostring(fields[4]),
             Protocol = tostring(fields[5]),
             Direction = tostring(fields[6]),
             Decision = tostring(fields[7]),
             State = tostring(fields[8]),
             PacketsSrcToDst = toint(fields[9]),
             BytesSrcToDst = toint(fields[10]),
             PacketDstToSrc = toint(fields[11]),
             BytesDstToSrc = toint(fields[12])
    | project-away flows, flowsFlows, flowsFlowsTuples,fields
}
Finally, we need a target table where the pipeline will put the parsed records. The data structure of this table must match exactly the output of the pipeline function above:
// Create target table for NSG Flow Logs
.create table flowLogs (
    Time:datetime,
    macAddress:string,
    category:string,
    flowLogVersion:int,
    nsgResourceID:string,
    flows:dynamic,
    rule:string,
    flowsFlows:dynamic,
    macAddress2:string,
    flowsFlowsTuples:dynamic,
    Timestamp:string,
    srcIP:string,
    dstIP:string,
    srcPort:string,
    dstPort:string,
    Protocol:string,
    Direction:string,
    Decision:string,
    State:string,
    PacketsSrcToDst:int,
    BytesSrcToDst:int,
    PacketsDstToSrc:int,
    BytesDstToSrc:int
)
Finally, we glue together the raw table with the pipeline:
// Update policy for rawFlowLogs
.alter table flowLogs policy update
@'[{ "IsEnabled": true, "Source": "rawFlowLogs", "Query": "FlowLogMapping()", "IsTransactional": false, "PropagateIngestionProperties": false}]'
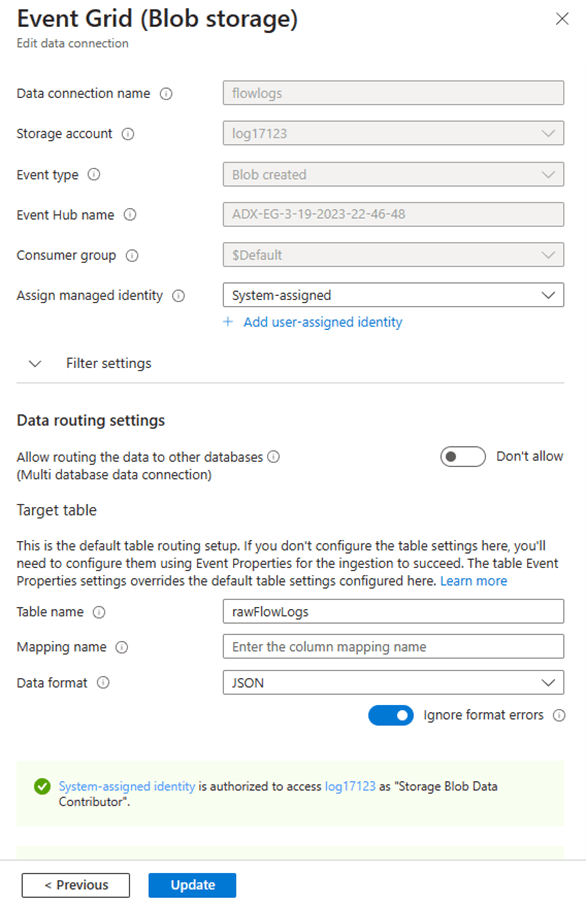
Now for every Azure Storage account with flow logs you configure Azure Data Explorer to ingest the data into the raw pipeline. The Azure portal will create the required Event Grid that will serve as intermediary between the storage account and ADX.
ADX identity (system-assigned or user-assigned) needs to have access to the storage account. Finally, the mapping name can be left blank, since we already configured the pipeline in ADX with the previous steps (see Create an Event Grid data connection for Azure Data Explorer for more details):
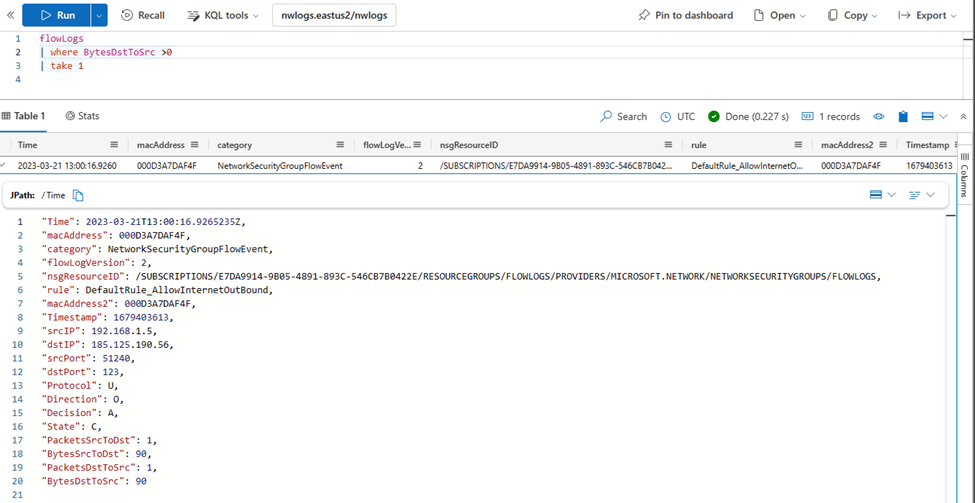
The result is that the flow logs will appear in the destination table after some minutes:
Note that ADX supports the advanced Kusto functions for IPv4 management. For example, this query gives out the total bytes sent from private IP addresses (RFC1918) to non-private IP addresses, leveraging Kusto functions such as ipv4_is_match and ipv4_is_in_any_range:
flowLogs
| extend SrcIPisPrivate = ipv4_is_in_any_range(srcIP, dynamic(["10.0.0.0/8", "192.168.0.0/16", "172.16.0.0/12"]))
| extend DstIPisPrivate = ipv4_is_in_any_range(dstIP, dynamic(["10.0.0.0/8", "192.168.0.0/16", "172.16.0.0/12"]))
| where isnotnull(SrcIPisPrivate) and isnotnull(DstIPisPrivate)
| extend FlowType = iff(SrcIPisPrivate and DstIPisPrivate, "PrivateToPrivate", iff(SrcIPisPrivate and not(DstIPisPrivate), "PrivateToPublic",iff(DstIPisPrivate and not(SrcIPisPrivate), "PublicToPrivate", "PublicToPublic")))
| summarize SumBytesSrcToDst=sum(BytesSrcToDst), SumBytesDstToSrc=sum(BytesDstToSrc) by FlowType

These functions for IPv4 addresses can be extremely useful, for example to get queries that aggregate data transfer statistics between Azure regions, or between Azure and on-premises.
Logs can be down-sampled to reduce storage costs, as described in Controlling costs in Azure Data Explorer using down-sampling and aggregation | Azure Blog and Updates | Microsoft Azure.
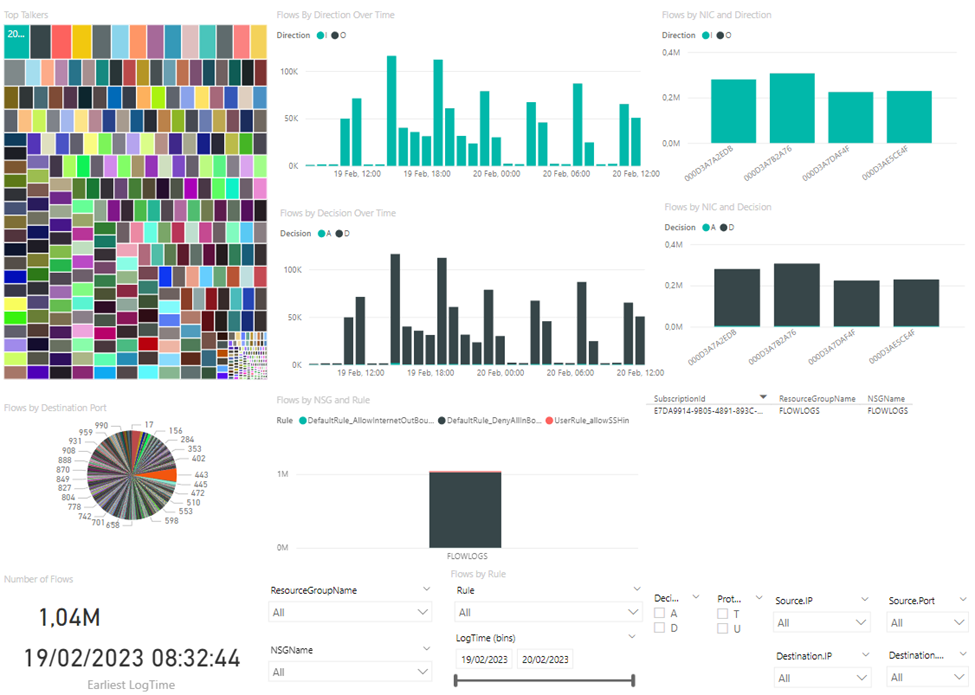
Last but not least, dashboards are now supported in Azure Data Explorer, and they are quite easy to use (Visualize data with the Azure Data Explorer dashboard | Microsoft Learn). Here you can see a sample dashboard I created in some minutes:

The dashboard I used for the screenshot above can be created from this file: azcli/flowlogs-ADXdashboard.json at master · erjosito/azcli (github.com), if you don’t feel like creating it yourself.
Elastic
For customers that would like to use an open source solution, the Elastic Stack can be a good solution. Elastic Stack is a combination of multiple elements:
- ElasticSearch: high-performance database, comparable to ADX
- Kibana: visualization engine, that has taken a more prominent role in the Elastic Stack lately, for example offering the UI to manage the whole solution
- Integrations: different components can collect information from data sources and put them into the ElasticSearch database
- Filebeat and Metricbeat are components that are used to extract logs and metrics from many sources, and seem to be the future for ingestion in Elastic. However, they lack some pipeline capabilities if the source data is not formatted correctly
- Logstash is an previous ingestion mechanism that supports rich pipelines, and this is the method that we have been using to ingest flow logs in Elastic
In the official docs for integration with Elastic (Visualize NSG flow logs – Elastic Stack – Azure Network Watcher) the logstash plugin for Azure Blob Storage is recommended (azureblob). However, this plugin is not maintained any more, so we will have to use other plugins maintained by individuals outside of Microsoft. One of such plugins is azure_blob_storage, where JanMG has done a fantastic job.
With the help of such a plugin, Elastic can be easily configured to ingest and display Flow Logs, and in the rest of this section I will cover the steps to do it in detail.
There are many guides for Elastic Stack installation, here an example of how this can be done with Azure CLI (I don’t include the exact variables, you can see the whole script here):
echo "Creating Elastic Stack VM..."
az vm create -n $elk_vm_name -g $rg -l $location --image ubuntuLTS --generate-ssh-keys --nsg "${elk_vm_name}-nsg" -o none \
    --custom-data $elk_cloudinit_file --public-ip-sku Standard --public-ip-address "${elk_vm_name}-pip" \
    --vnet-name $vnet_name --size $elk_vm_size --subnet $elk_subnet_name -l $location
# Make sure to reset the elastic user's password with elasticsearch-setup-password or elasticsearch-reset-password !!!!
echo "Sleeping now until Elastic gets installed..."
sleep 300
echo "You will be prompted now to reset the Elastic and Kibana passwords. Please enter the value of the defaultPassword variable/secret (see above in the script):"
elk_pip=$(az network public-ip show -n "${elk_vm_name}-pip" -g $rg --query ipAddress -o tsv)
ssh $elk_pip "sudo /usr/share/elasticsearch/bin/elasticsearch-reset-password -u elastic -i"
ssh $elk_pip "sudo /usr/share/elasticsearch/bin/elasticsearch-reset-password -u kibana -i"
# Verify Elastic Search VM
if [[ -z "$default_password" ]]; then
    echo "ERROR: default_password is empty. Please enter the value of the defaultPassword variable/secret (see above in the script):"
    read default_password
fi
ssh -n -o BatchMode=yes -o StrictHostKeyChecking=no $elk_pip "systemctl status elasticsearch"
ssh -n -o BatchMode=yes -o StrictHostKeyChecking=no $elk_pip "systemctl status kibana"
ssh -n -o BatchMode=yes -o StrictHostKeyChecking=no $elk_pip "curl -sk -u elastic:${default_password} https://localhost:9200"
ssh -n -o BatchMode=yes -o StrictHostKeyChecking=no $elk_pip "curl -sk -u kibana_system:${default_password} https://localhost:9200/_xpack/security/_authenticate?pretty"  # Not working!
ssh -n -o BatchMode=yes -o StrictHostKeyChecking=no $elk_pip "curl -sk -u elastic:${default_password} https://localhost:9200/_cluster/health"
# Configure ElasticSearch and Kibana
echo "Configuring ElasticSearch and Kibana..."
ssh -n -o BatchMode=yes -o StrictHostKeyChecking=no $elk_pip "sudo sed -i '/network.host/c\network.host: 0.0.0.0' /etc/elasticsearch/elasticsearch.yml"
ssh -n -o BatchMode=yes -o StrictHostKeyChecking=no $elk_pip "sudo systemctl restart elasticsearch"
ssh -n -o BatchMode=yes -o StrictHostKeyChecking=no $elk_pip "sudo sed -i '/server.host/c\server.host: \"0.0.0.0\"' /etc/kibana/kibana.yml"
ssh -n -o BatchMode=yes -o StrictHostKeyChecking=no $elk_pip "sudo sed -i '/server.name/c\server.name: \"elastictest\"' /etc/kibana/kibana.yml"
ssh -n -o BatchMode=yes -o StrictHostKeyChecking=no $elk_pip "sudo sed -i '/elasticsearch.username/c\elasticsearch.username: \"kibana\"' /etc/kibana/kibana.yml"
ssh -n -o BatchMode=yes -o StrictHostKeyChecking=no $elk_pip "sudo sed -i '/elasticsearch.password/c\elasticsearch.password: \"$default_password\"' /etc/kibana/kibana.yml"
ssh -n -o BatchMode=yes -o StrictHostKeyChecking=no $elk_pip "sudo sed -i '/elasticsearch.hosts/c\elasticsearch.hosts: [\"https://localhost:9200\"]' /etc/kibana/kibana.yml"
ssh -n -o BatchMode=yes -o StrictHostKeyChecking=no $elk_pip "sudo sed -i '/elasticsearch.ssl.verificationMode/c\elasticsearch.ssl.verificationMode: none' /etc/kibana/kibana.yml"
ssh -n -o BatchMode=yes -o StrictHostKeyChecking=no $elk_pip "sudo systemctl restart kibana"
# Install logstash plugin
# ssh -n -o BatchMode=yes -o StrictHostKeyChecking=no $elk_pip "sudo /usr/share/logstash/bin/logstash-plugin install logstash-input-azureblob"  # Errors out!
ssh -n -o BatchMode=yes -o StrictHostKeyChecking=no $elk_pip "sudo /usr/share/logstash/bin/logstash-plugin install logstash-input-azure_blob_storage"
After having an operational Elastic Stack implementation with logstash and its blob storage plugin, you can configure the plugin to ingest data through a pipeline. Here is the one I have been using, courtesy of janmg (you can put it in /etc/logstash/conf.d/logstash.conf, or any .conf file in /etc/logstash/conf.d). More information about how to configure this plugin in the GitHub repo azure_blob_storage:
input {
    azure_blob_storage {
        codec => "json"
        storageaccount => "$storage_account_name"
        access_key => "$storage_account_key"
        container => "insights-logs-networksecuritygroupflowevent"
        logtype => "nsgflowlog"
        prefix => "resourceId=/"
        path_filters => ['**/*.json']
        addfilename => true
        interval => 60
        debug_timer => true
        debug_until => 100
        registry_create_policy => "start_over"
    }
}
filter {
    json {
        source => "message"
    }
    mutate {
        add_field => { "environment" => "test-env" }
        remove_field => [ "message" ]
    }
    date {
        match => ["unixtimestamp", "UNIX"]
    }
}
output {
    stdout { codec => json }
    elasticsearch {
        hosts => ["https://localhost:9200"]
        index => "nsg-flow-logs-%{+xxxx.ww}"
        ssl => true
        ssl_certificate_verification => false
        user => "elastic"
        password => "$default_password"
    }
}
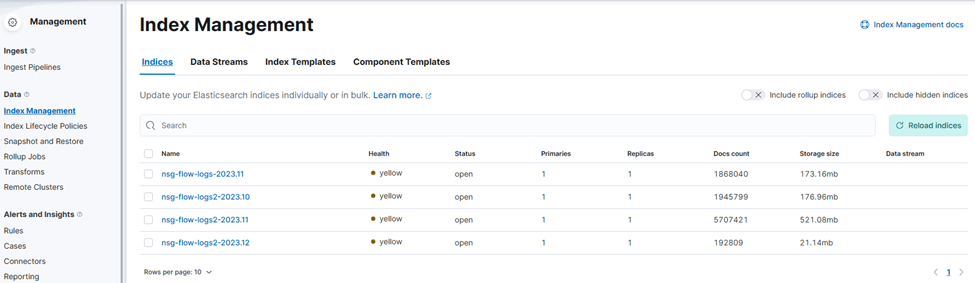
You can check now that indexes have been created in Elastic (in the following screenshot you can see indexes created with two versions of the pipeline, “nsg-flow-logs-“ and “nsg-flow-logs2-“):
Now you need to create a data view to match the indexes:
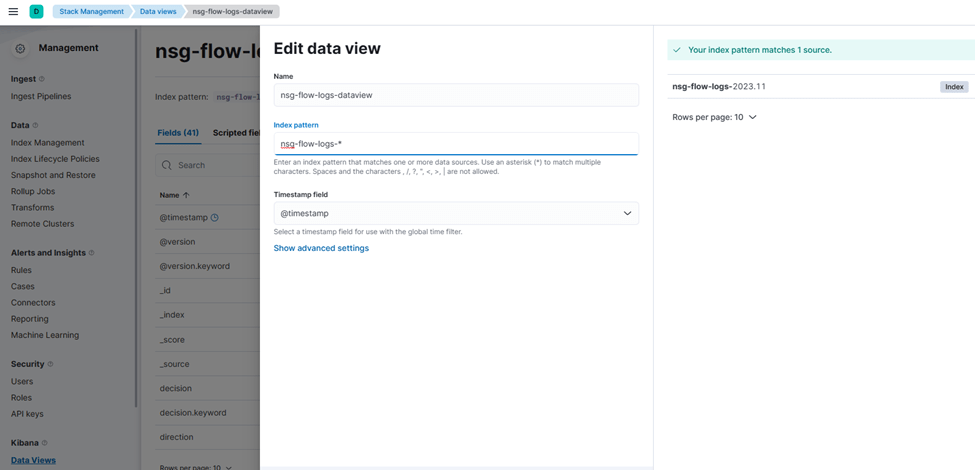
After the data view is there, you can now start creating the dashboard:
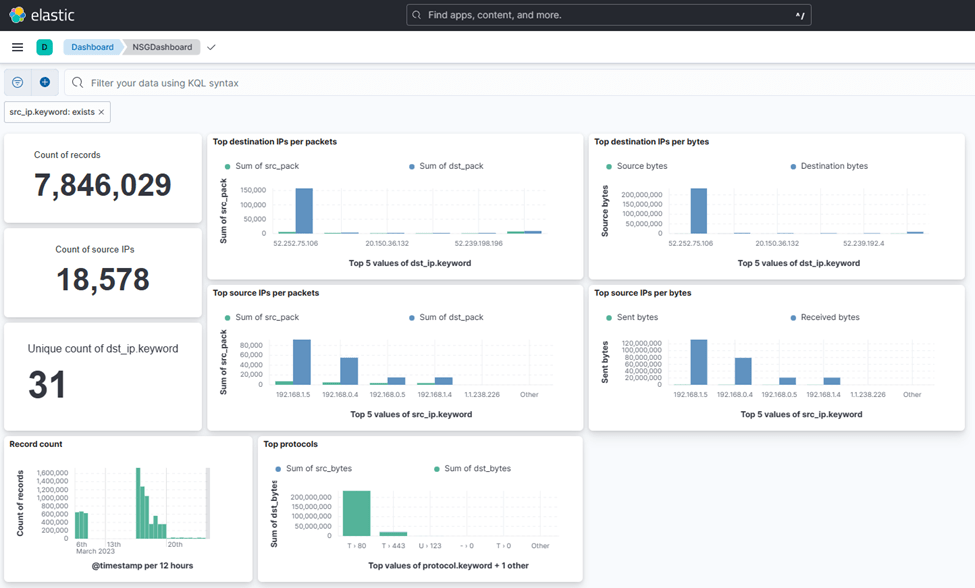
If you would like to import these objects instead of creating them yourself, I have some exported versions for the index in flowlogs_index.ndjson, and for the dashboard in flowlogs_dashboard.ndjson.
You made it!
This was one of my longest posts, thanks for making it all the way down to here! Hopefully I could give you some ideas in case Traffic Analytics is not the best solution for you to ingest and analyze Azure Flow Logs. And if that is the case, we would love to hear your feedback in the comments, since our final goal is making Traffic Analytics as good as it gets!

https://feedback.azure.com/d365community/idea/b9050dd1-1b47-ee11-a81c-0022484c92b1
There is so much of duplication in the ADX ingested logs, as every append to the Blob container by NSG will result in complete ingestion of the entire blob content. The blob container is appended with data worth 1 hour before its rotated. And we have de-duplicate the traffic logs besides paying the bandwidth cost for this duplication.
LikeLike
https://feedback.azure.com/d365community/idea/b9050dd1-1b47-ee11-a81c-0022484c92b1
ADX Blob ingestion approach wont work due to data duplication. High costs for redundant bandwidth and deduplication.
LikeLike
Hey Srinivas, can you be more specific? What do you mean exactly with data duplication?
LikeLike
The NSG Flow Logs append logs to Blob container every 1 minute. Every 1 minute the service bus sends a notification to the ADX Blob connector. ADX blob connector ingests the entire blob container rather than the latest Flow logs, as it does not read from the previous offset in the blob container. So for 1 hour, the entire blob container data is ingested every 1 minute. Thats the data duplication for which i raised a support case and Azure team has ack the issue but have no fix.
LikeLike
That explains it Srinivas, thanks for the detailed explanation!
LikeLike
[…] Logs. Back in the day I blogged about how to use NSG Flow Logs to detect traffic anomalies, about different ways to access NSG Flow Logs, and more recently about the main functional differences between VNet FLow Logs and ExpressRoute […]
LikeLike