
Sometimes it is difficult analyzing the routing behavior of your Azure environment: on one side you have Virtual WAN routing rules, which are defined by settings such as routing intent and hub routing preferences, and on the other you have connectivity technologies such as ExpressRoute, SD-WAN and VPN tunnels with static routing or BGP. Not to mention the added complexity of on-prem networks that might have their own behavior.
Normally I used to follow this approach to understand a VWAN configuration :
- Step 1: Draw the topology in a whiteboarding app (Excalidraw is lately my go-to app, but anything works).
- Step 2: Deep breath.
- Step 3: Start capturing effective routes and BGP tables to understand the traffic flows.
Is this the right way to do it? For small environments it might be good enough, but a couple of weeks ago I was confronted with a slightly larger setup (3 virtual hubs and 3 onprem sites), and frankly, that size was already challenging. But fear not, we live in the AI age, so why not creating a simulator that can make life easier for all of us network administrators? Welcome to the VWAN simulator: https://vwan-simulator.com!
What is the VWAN Simulator?
I am glad you ask, and I have a documentation page for you: Virtual WAN Topology Lab. Now seriously, it is essentially a tool with which you can build a logical model (or maybe I should call it a “digital twin”, it sounds fancier) of a network, comprising on-premises sites and Azure VNets interconnected by Virtual WAN.
It is a static web app that runs all logic in your browser, so you are not uploading information about your environment anywhere. You don’t need to register or login, all information is kept on your end. You can create your topology manually using the controls in the app, or you can upload a JSON file that contains a topology shared with you by somebody else. You can even generate a topology from your existing VWAN environment:

Displaying routing tables
The simulator supports route maps and different configuration in your virtual hubs, and it shows you the resulting routing tables such as BGP tables and advertised and learned routes:
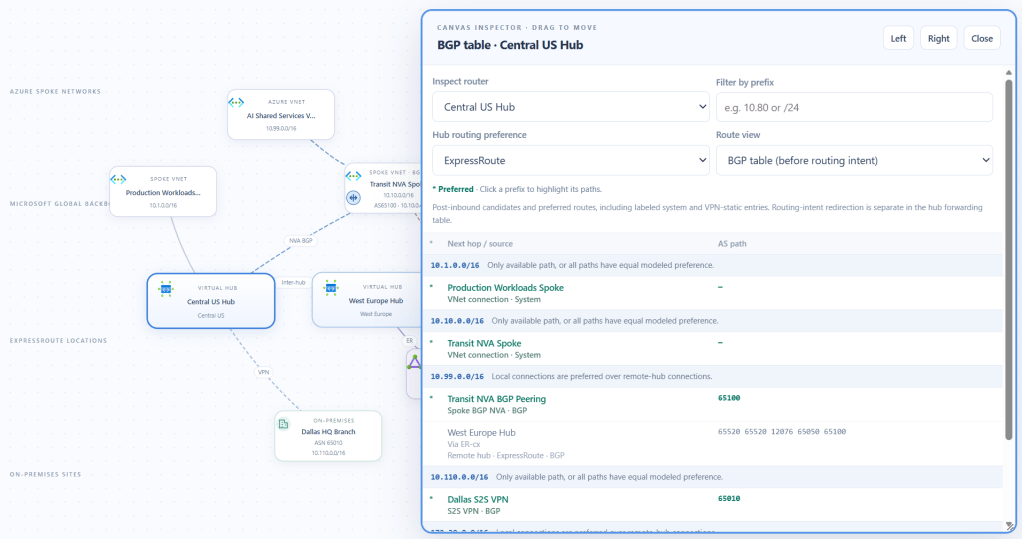
It will consider the Hub Routing Preference that you define in each virtual hub and explain you why each route was picked.
Showing paths
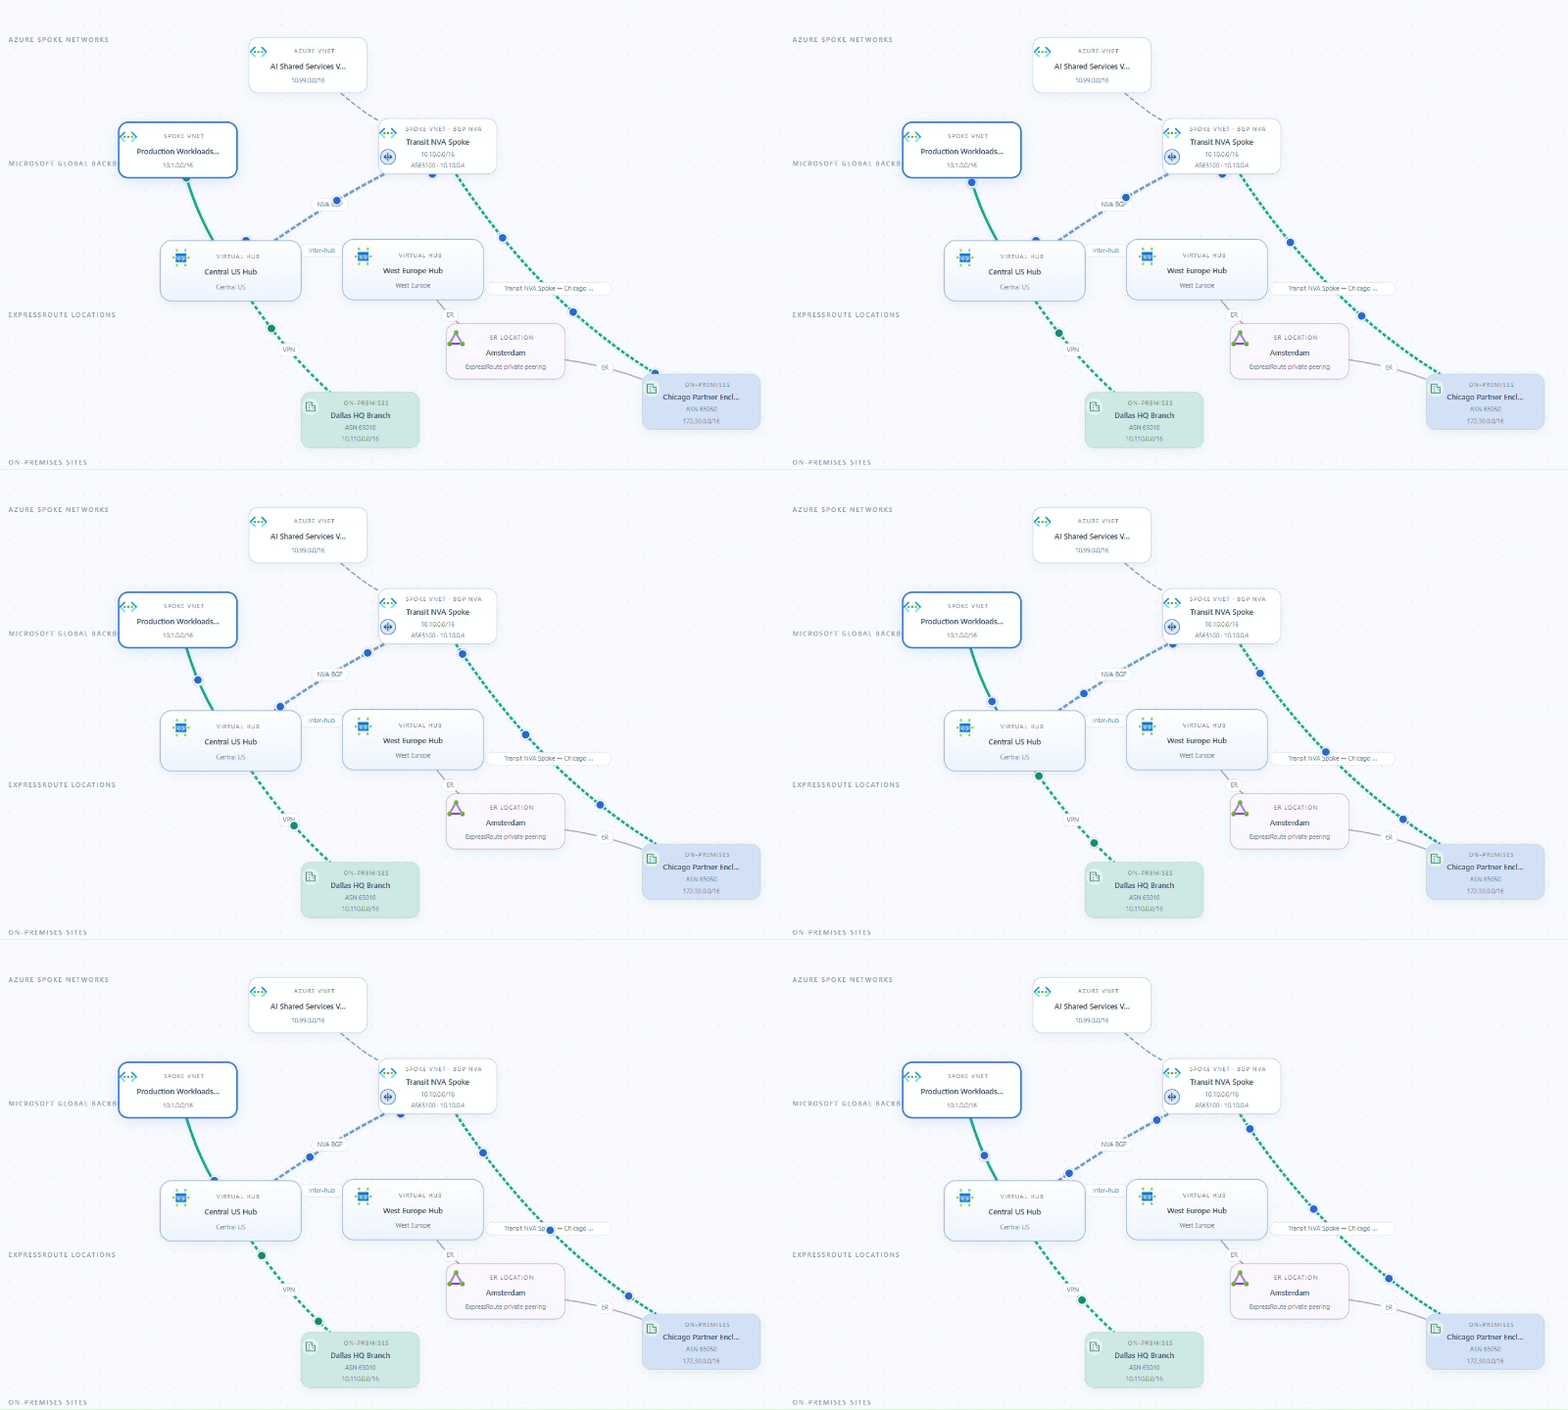
You can also display the traffic paths that packets will follow, either from one specific node to another one, or between sets of nodes. For example, the following image shows the paths from one spoke VNet to both onprem sites in the topology:
Detecting asymmetric routing
Some issues are hard to find out when you are looking at routing tables, for example asymmetric routing. Since each direction of the path is decided by different routers, you need to compare different route tables to make sure that your routing is symmetric. Otherwise, stateful firewalls in the data path will probably drop packets. The VWAN simulator analyzes all routing tables to detect routing issues, such as situations where you have asymmetric routing:
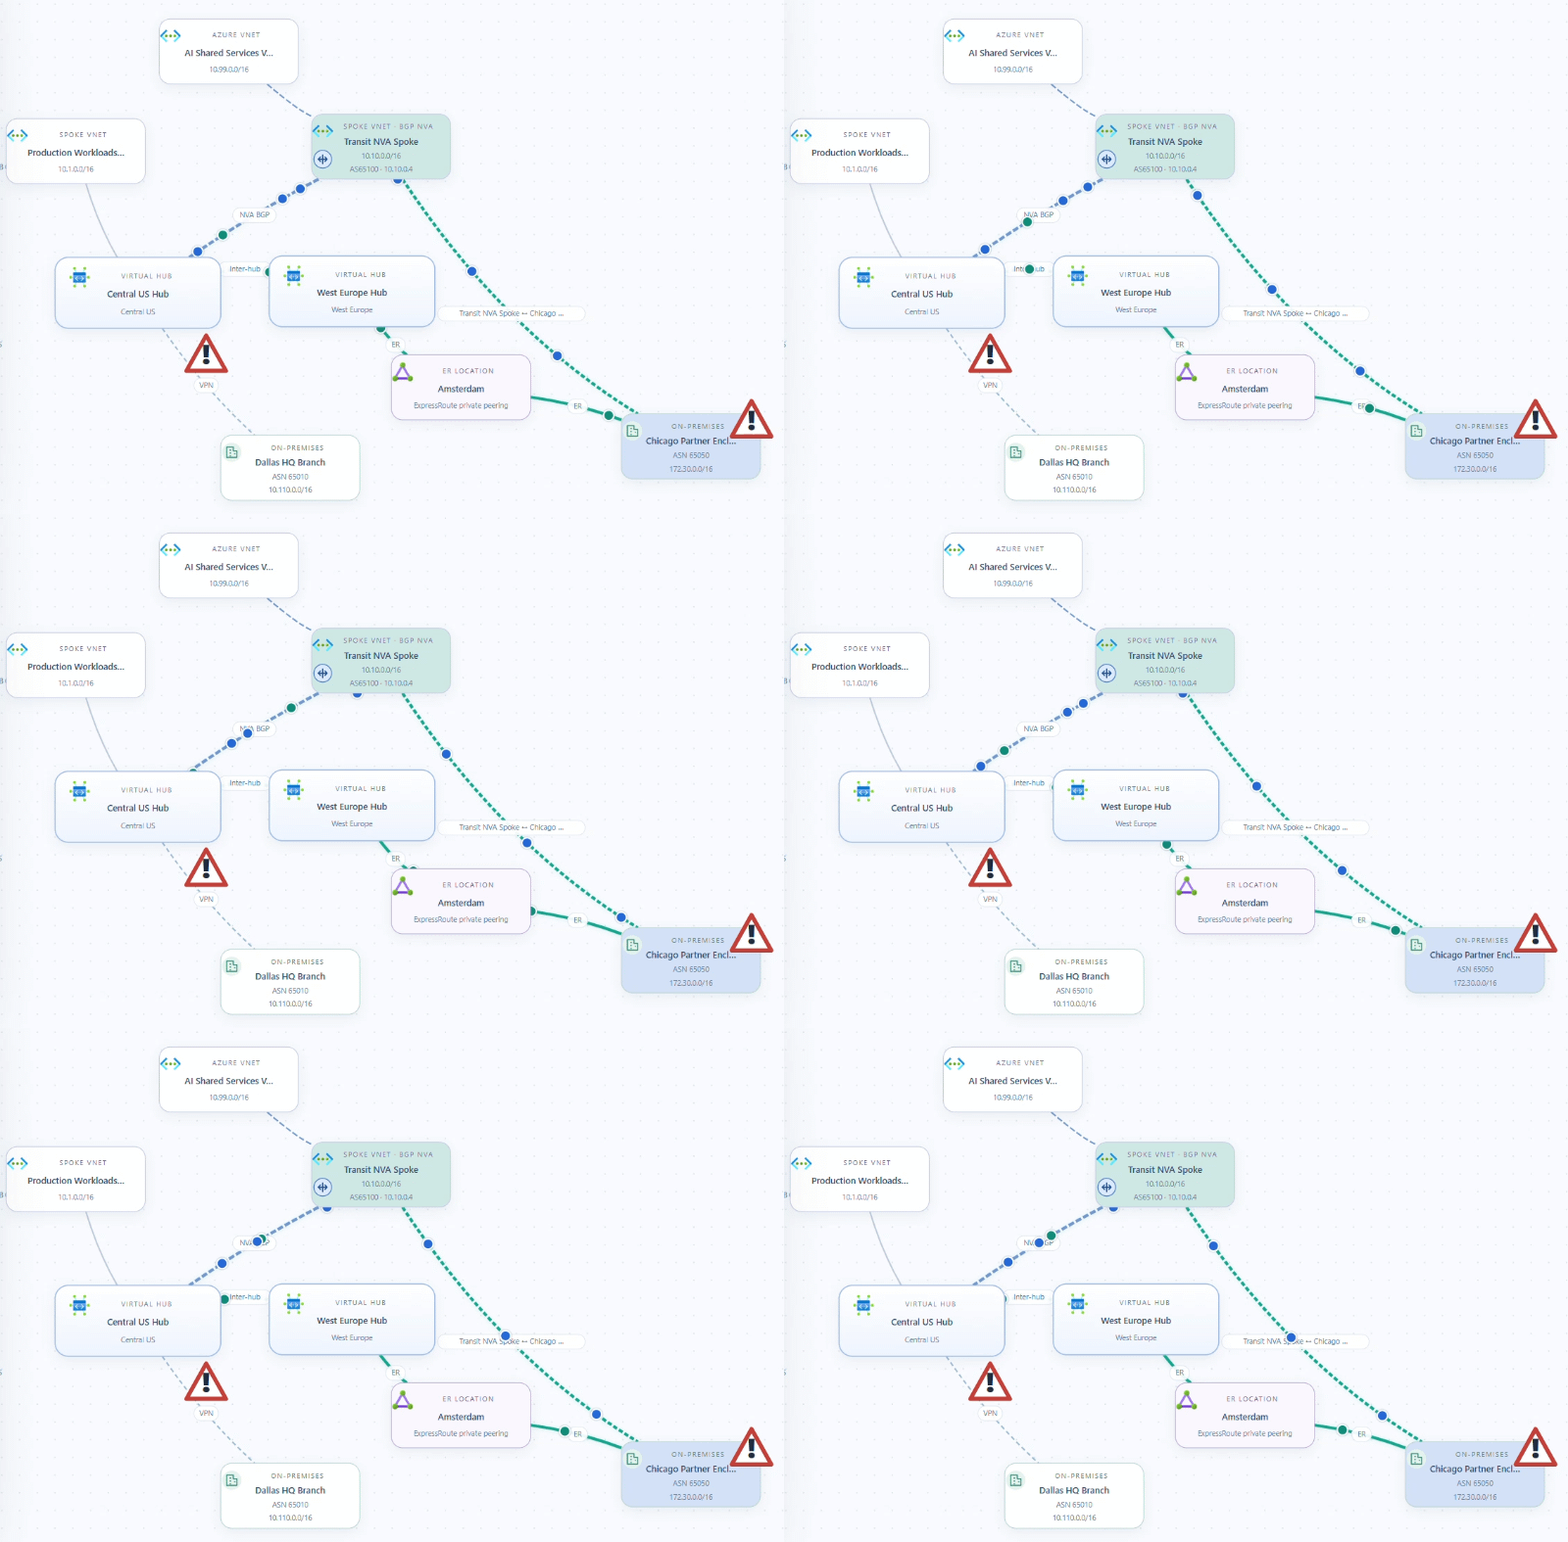
It also detects single points of failures, as it is the case with “Dallas HQ Branch” above, which is the reason why its connection has a danger sign on it.
Just play with it!
You can deploy your own topology or start with the sample files I have in vwan-visual-topology-feedback/samples. The tool also has a feedback button that will take you to a GitHub page where you can file an issue, and let me know anything you like: new features you would like to see, bugs that you found, or just whether you love or hate the tool.
The tool hasn’t been battle-tested yet, so please be gentle and adjust your expectations. That being said, if it can save you a couple of minutes of work, I would call it mission accomplished!

