
Wow, that was a mouthful. But it describes what I would like to discuss in this post. Networks are at the basis of every IT infrastructure, so when they don’t work, everybody notices (and when they do work, nobody notices). Hence, monitoring computer networks to detect and fix problems as quickly as possible is a discipline where many IT professionals have invested countless hours.
There are many ways in which you can monitor a network: watching for packet drops or unusual activity in the network devices statistics, getting notified when the health stats of routers and switches go South, etc. Although that sort of monitoring is certainly extremely useful, there is another category of monitoring that you should be doing as well: synthetic traffic.
In essence, this is about sending pings (as well as other protocols) between different points in your network, and alerting when any of those flows break. This allows to detect connectivity problems that other monitoring techniques might not catch, without having to wait for the end user to pick up the phone and call us (or opening an incident ticket). Some networking vendors such as Cisco have similar functionality in their devices (in Cisco it is called “IP SLA”).
Easy enough, right? Welcome to Azure Connection Monitor!
Sample topology with Azure Connection Monitor
To try out Connection Monitors, I have deployed a Virtual WAN environment with two Virtual Networks connected to it, an Azure Firewall, and an ExpressRoute circuit. The Topology view in Network Watcher can display this:

I have deployed a virtual machine in each of the virtual networks with an apache2 web server as application, as well as a virtual machine in the Google VPC which is simulating the on-premises environment for me. Have I configured my network properly? Well, the Connection Monitors will tell:

Yay, all green! Connection Monitor generates synthetic traffic from each of the source Azure VMs, and tries connections over multiple protocols to the specified destinations. The sources, the protocols (known as “configurations”) and the destinations is what you configure in the Connection Monitor test groups:
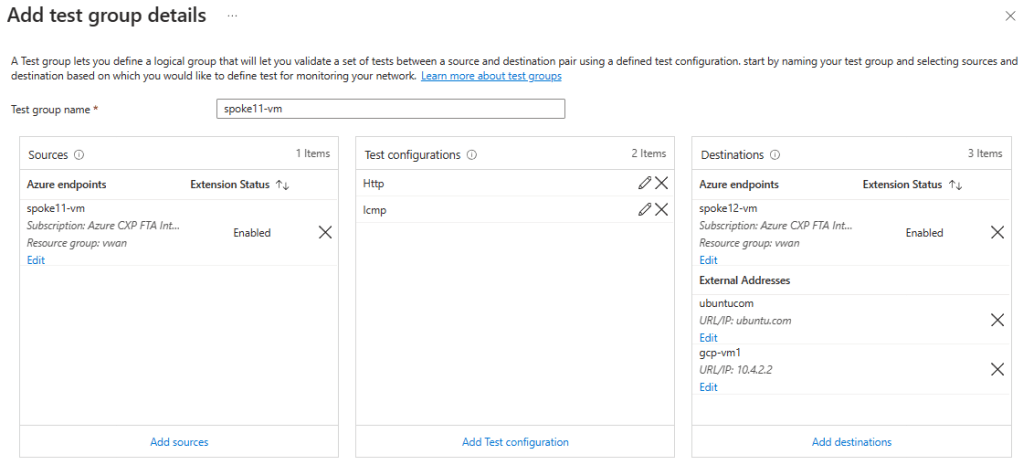
At this time, Azure virtual machines as well as on-premises systems are supported as Connection Monitor sources. When you configure an Azure virtual machine as a Connection Monitor source, an Azure extension (think “agent”, see Network Watcher Agent virtual machine extension for Linux for more details) is installed automatically, so that traffic can be generated. If using a non-Azure system, you need to install the agent yourself.
Ping is not enough
Please, please, please: do not limit yourself to ICMP traffic. First of all, you will not catch asymmetric routing issues if you only test with pings. Second, you will not detect incorrectly configured traffic filtering that drops your application.
Consequently, make sure that you test some TCP ports as well. Ideally ports of your application. If those are too many you can try with HTTPS (TCP port 443). In the example above I am testing with an HTTP-specific configuration, which not only will verify that the TCP connection to the destination is established, but as well that the returned HTTP code is correct.
Configure alerts!
You have come almost all the way, why stopping here? There is only a very small step left, but you shouldn’t forget to take it: get notified when something breaks. You can use the standard Azure Monitor alerting framework to configure alerts upon Connection Monitor failures. For example, I have defined my alerts like this:
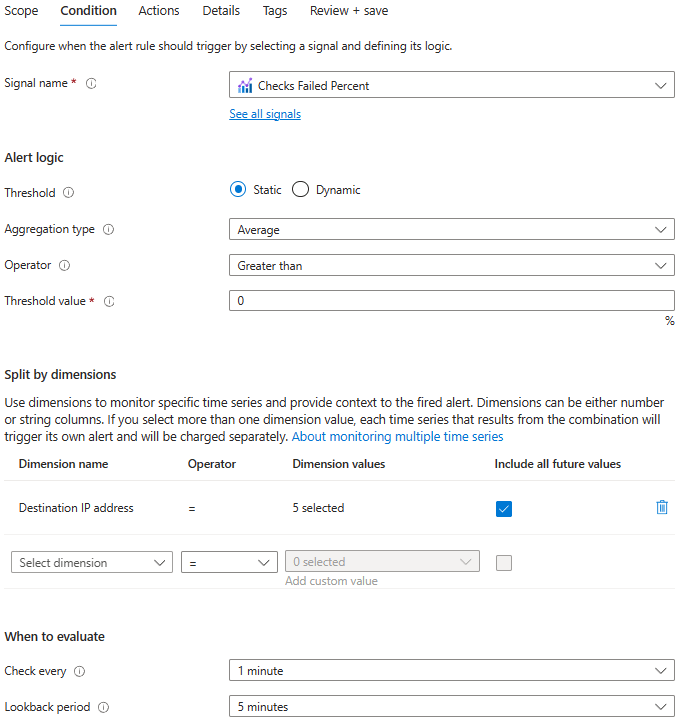
Let’s unpack all these values:
- First, I am looking at the percentage of failed checks, at this time I am not necessarily interested in latency.
- I have defined a static threshold of 0%: whenever there is a single failure, I will get notified. This might generate a bit of noise, so you probably want to set this threshold higher.
- I am breaking up the metrics (splitting) per destination IP address, so that for every destination IP address for which a test fails, a different alert will be fired.
- Lastly, the alert logic will be run every minute, and will look back to 5 minutes of data to decide whether firing or not.
Let’s fire!
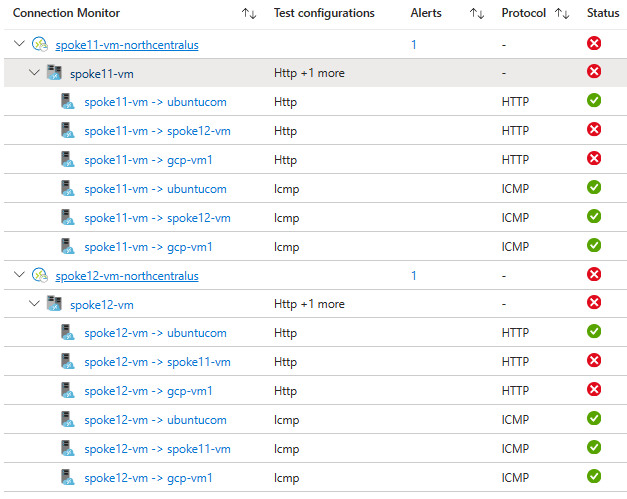
I always like this part: introducing faults in the system. I am going to block port 80 in my Azure Firewall, simulating a security admin that (rightly) decided that port 80 should not be used in my environment. How would my Connection Monitors react to this?
First, the actual state of the connection monitors will reflect the fact that HTTP probes are down, but ICMP probes are still going strong. This already tells me that this is not a problem of routing, but rather of traffic filtering:
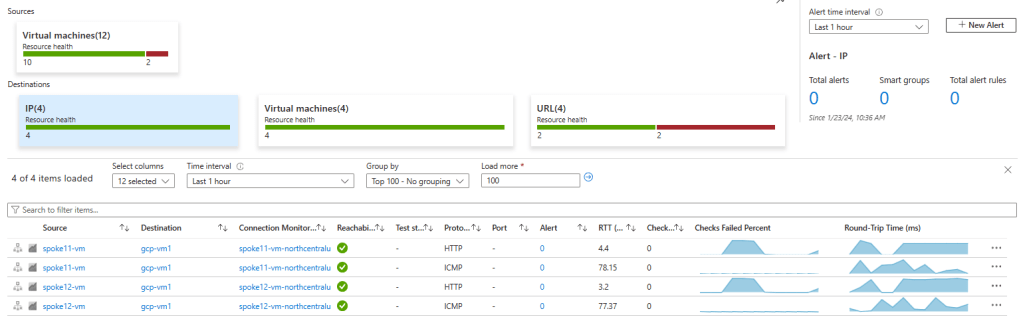
I don’t need to go to Connection Monitor to find out that something is wrong in my network. Looking at Azure Monitor in Network Insights I can already tell, with additional information on the latest checks:
When the alert is fired, I will be notified in the ways that are configured in the alert definition. In my example, I just configured emails to be sent to my email address. Here a screenshot of the email I received (I blanked out the subscription ID):
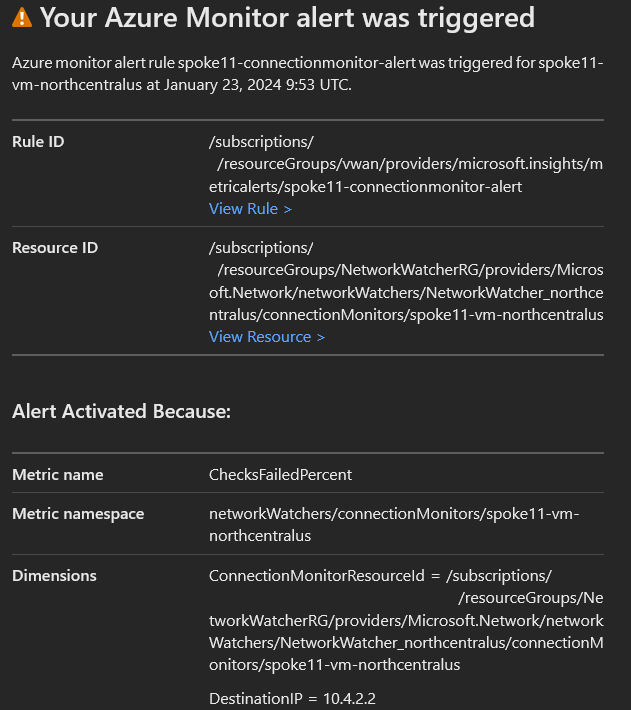
As you can see there is plenty of information in the received email. Since the alert was configured to split on the destination IP, I get the destination IP that is failing too. I didn’t configure to split on the protocol, hence the email doesn’t contain information about HTTP being the problem. The configuration of metric splitting in the alert definition is a balance between the information in the email or notification, and the number of emails or notifications that I want to receive.
Adding up
Synthetic traffic is not the only strategy you should follow when monitoring your network, but is certainly one that you should be looking into. Try Azure Connection Monitor today!

Thank you Jose! Like always great content!!
LikeLiked by 1 person