
If you work in Azure, you probably know about Connection Monitor, a tool that generates synthetic traffic to test connectivity and measure response times. You configure sources (Virtual Machines) to generate traffic that can be addressed to destinations such as other Virtual Machines or any external endpoint outside of Azure. Alerts can be automatically generated when the objectives for the test are not met (like connectivity loss or latency too high), and the test results are stored for further analysis in a Log Analytics workspace. If you come from a Cisco world, it is similar to the IP SLAs feature (even after so long working in Azure sometimes it helps me translating between worlds).
Azure Connection Monitor is perfect to monitor complex environments, and to be notified in anything in your network behaves in a different way. Synthetic traffic is adequate enough to measure your network performance, even if it is not going to be exactly the same as the actual production traffic (packet sizes might differ, for example). However, my goal here is not monitoring a production network, but I would like to show you how I use Azure Monitor to verify connectivity in a test environment.
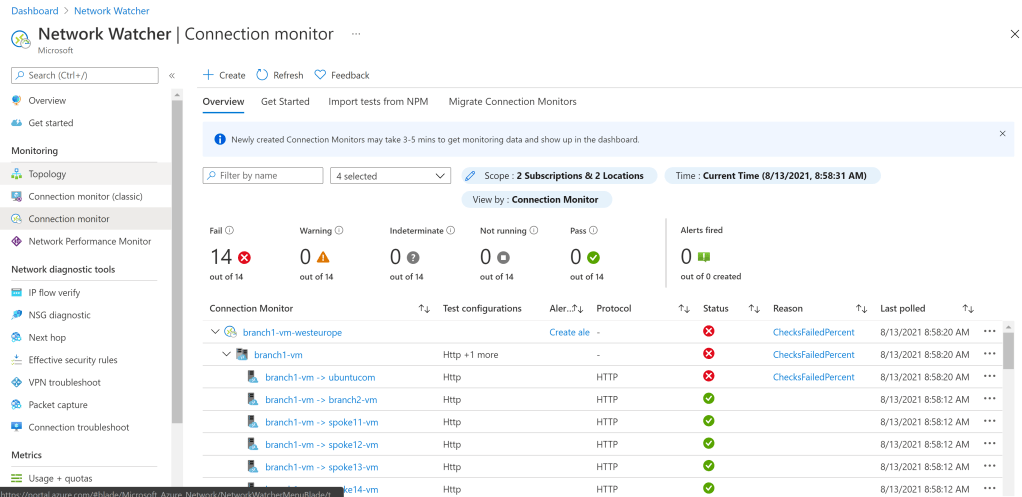
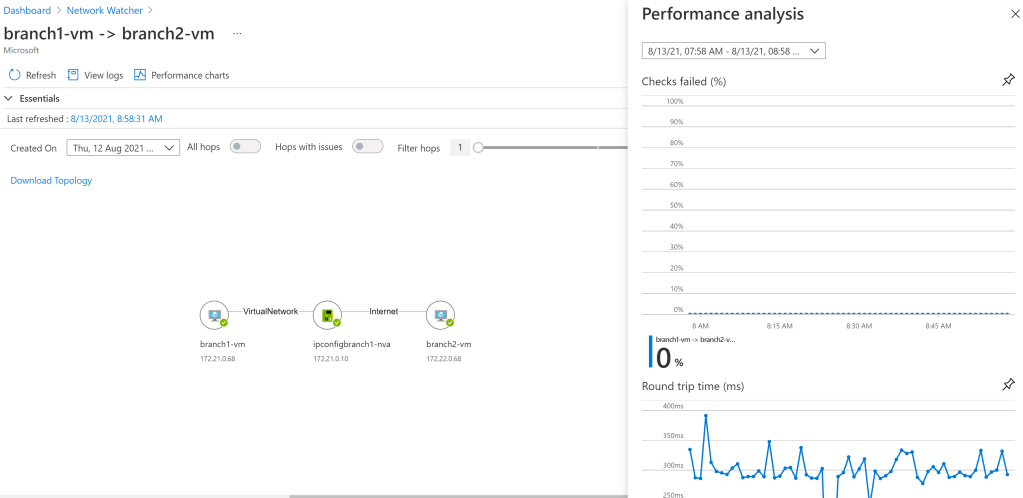
Before going on and on for ever, here some screenshots of what Azure Connection Monitor looks like in the Azure Portal. You have sources, test configurations (the network protocol used for the traffic) and destinations:
Why using Connection Monitor in a complex network topology? Before deploying your design, you probably want to test it. Or if you are a Microsoft partner, you probably test different network designs before offering one or two to a customer. Personally, I often find myself testing new configurations, and with it is often very hard to realize when a specific modification in your design has broken a specific flow.
Let me give you an example. I have recently tested a new feature that you will see coming up soon in Virtual WAN (I will only say that it has something to do with BGP, stay tuned for more). For Virtual WAN I often test a network topology similar to this one (which incidentally is the target topology of the Virtual WAN WhatTheHack that we recently published with my good friend Thomas Vuylsteke):
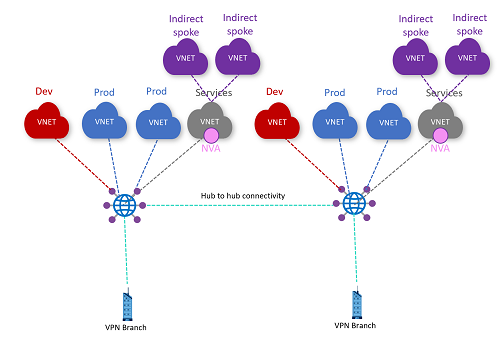
In this setup there are 14 endpoints: 2 regions times 7 VMs per region (6 VNets and 1 branch). That is 182 flows between every two-VM combination. If you throw a firewall into the mix, you normally test two network protocols, one allowed by the firewall and another one denied. That makes 364 flows. Put on top of that some additional flows for traffic to the public Internet . Now you make a change to the environment. Has any of the flows broken? What I want (and what I will show in this post how to get to) is this kind of visualization:

As you can see, for every endpoint pair I get two numbers: In my case I have two test configurations (I send ICMP and HTTP packets), which tell me exactly what’s working and what’s not working. For example:
- For some of the cells you see a “1/0”. This means that the first test (HTTP) worked, but the second (ICMP) didn’t. In my firewalls I deny ICMP packets, so that is a good thing.
- For other cells you see a “1/1”. The fact that ICMP works tells me that these flows do not traverse my firewalls (otherwise ICMP would have been dropped)
- For other some cells you see “0/0”, which would indicate a connectivity problem. In this case Internet is broken for some flows, which in my particular testbed indicates a problem with the SNAT configuration in my firewalls (required for Internet connectivity)
- Finally, “N/A” stands for “Not Applicable”: a connectivity test between an endpoint and itself doesn’t make a ton of sense
With this sort of matrix I can document my test results, and after a specific change I just go for a coffee, let Connection Monitor some time to run its tests, and when I get back I have a look of which flow is now right, and which one is still wrong. The only bad side of this is that my coffee consumption has dramatically increased.
Building the Connection Monitors
We spoke about 364 different tests. You don’t want to build those manually. If you read my posts, you probably know by now that I do most stuff with a Linux shell (zsh) and Azure CLI. Connection Monitor has Azure CLI support, so the only thing that the code needs to do is create a list of sources (all virtual machines in a resource group that contain a certain string), a list of destinations (same as the source list), and loop through both to create the different connection monitor tests:
# Get all VMs containing the string "vm" (that excludes the NVAs)
vm_list=$(az vm list -g $rg --query "[?contains(name,'vm')].name" -o tsv | sort -u)
# Build an associative array with all VM IDs
declare -A vm_id_list
echo "Getting VM IDs..."
while IFS= read -r vm_name
do
    vm_id=$(az vm show -g $rg --query id -o tsv -n $vm_name)
    vm_id_list+=([$vm_name]="$vm_id")
done <<< "$vm_list"

# Create connection monitors
while IFS= read -r src_vm
do
    test_name="${src_vm}"
    location=$(az vm show -n $src_vm -g $rg --query location -o tsv)
    monitor_name="${src_vm}-${location}"
    echo "Creating connection monitor for source $src_vm in $location..."
    # The monitor is created with an HTTP config to ubuntu.com
    az network watcher connection-monitor create -n $monitor_name -g $rg -l $location \
        --test-group-name $test_name --endpoint-source-type AzureVM --endpoint-dest-type ExternalAddress \
        --endpoint-source-resource-id "$vm_id_list[$src_vm]" --endpoint-source-name $src_vm \
        --endpoint-dest-address "ubuntu.com" --endpoint-dest-name ubuntucom \
        --test-config-name Http --protocol Http --http-method GET --https-prefer false -o none
    # An ICMP config is added
    echo "Adding ICMP config to connection monitor $monitor_name..."
    az network watcher connection-monitor test-configuration add --connection-monitor $monitor_name -l $location \
        -n Icmp --protocol Icmp --icmp-disable-trace-route false --test-groups $test_name -o none
    # Plus the rest of the VMs are added as targets
    while IFS= read -r dst_vm
    do
        if [[ "$src_vm" != "$dst_vm" ]]
        then
            echo "Adding destination $dst_vm to connection monitor $monitor_name..."
            az network watcher connection-monitor endpoint add --connection-monitor $monitor_name -l $location \
                --resource-id "$vm_id_list[$dst_vm]" --name $dst_vm --type AzureVM --dest-test-groups $test_name -o none
        fi
    done <<< "$vm_list"
done <<< "$vm_list"
There is only a tiny bit of pixie dust there:
- I use
sort -uto remove duplicates (-ustands for “unique”) - To speed up the resolution of VM name to VM ID I create an associative array (
declare -A) - I start by creating the connection monitor test to an external endpoint (ubuntu.com)
- And then I add the VM destinations, one by one
One more thing to mention, is that the Virtual Machines need to have the Network Watcher extension installed in advance. You can easily install this extension with one single command:
az vm extension set --vm-name $vm_name -g $rg \
   --name NetworkWatcherAgentLinux --version 1.4 \
   --publisher Microsoft.Azure.NetworkWatcher
Displaying the Connection Monitor results
Alright, we have our connection monitors. Of course, you can use the Azure CLI to verify that your connection monitors have been successfully created. One peculiarity of Network Watcher is that as you might have noticed, you don’t create the Connection Monitors in a resource group, but in a region:
❯ az network watcher connection-monitor list -l $location1 -o table

ConnectionMonitorType    Location    Name                    ProvisioningState    ResourceGroup     StartTime
-----------------------  ----------  ----------------------  -------------------  ----------------  --------------------------------
MultiEndpoint            westeurope  branch1-vm-westeurope   Succeeded            NetworkWatcherRG  2021-08-12T07:02:42.645067+00:00
MultiEndpoint            westeurope  spoke11-vm-westeurope   Succeeded            NetworkWatcherRG  2021-08-12T07:09:55.912905+00:00
MultiEndpoint            westeurope  spoke12-vm-westeurope   Succeeded            NetworkWatcherRG  2021-08-12T07:13:32.757900+00:00
MultiEndpoint            westeurope  spoke13-vm-westeurope   Succeeded            NetworkWatcherRG  2021-08-12T07:17:16.056067+00:00
MultiEndpoint            westeurope  spoke14-vm-westeurope   Succeeded            NetworkWatcherRG  2021-08-12T07:21:42.259973+00:00
MultiEndpoint            westeurope  spoke141-vm-westeurope  Succeeded            NetworkWatcherRG  2021-08-12T07:25:30.011290+00:00
MultiEndpoint            westeurope  spoke142-vm-westeurope  Succeeded            NetworkWatcherRG  2021-08-12T07:29:08.231329+00:00
Alright, now it is a matter of letting Connection Monitor generate some traffic, and putting it all together. There is one difficulty though, which is that Network Watcher will put its data in a different Log Analytics workspace for each region. In my case I have 2 regions, so I will have 2 workspaces. In some cases I test with 3 regions (for example when I need to test complex ECMP scenarios), that means 3 workspaces. Hence a good part of the logic is getting the list of workspaces and doing a cross-workspace query. But before going into that, here the code:
# Represents results in table form (configurable interval, default 5m)
function monitor_results() {
    interval=5m
    table_width=12
    locations=($location1 $location2)
    # Get list of log analytics workspace IDs
    declare -a logws_id_list
    logws_id_list=()
    for location in "${locations[@]}"
    do
        logws_id_list_location=$(az network watcher connection-monitor list -l $location -o tsv --query '[].outputs[].workspaceSettings.workspaceResourceId')
        logws_id_list_location=$(echo $logws_id_list_location | sort -u)  # Unique values
        logws_id_list+=$logws_id_list_location
    done
    # Remove duplicates
    # logws_id_list=$(echo $(for i in ${logws_id_list[@]}; do echo "$i"; done) | sort -u)
    echo "${#logws_id_list[@]} workspaces found"
    # Get list of log analytics customerIds
    logws_customer_id_list_string=$(for logws_id in "${logws_id_list[@]}"; do logws_rg=$(echo $logws_id | cut -d/ -f 5); logws_name=$(echo $logws_id | cut -d/ -f 9) && az monitor log-analytics workspace show -n $logws_name -g $logws_rg --query customerId -o tsv; done)
    declare -a logws_customer_id_list
    logws_customer_id_list=()
    while IFS= read -r customer_id; do
        logws_customer_id_list+=$customer_id
    done << ago(1h) | distinct SourceName"
    src_list=$(for logws_customer_id in "${logws_customer_id_list[@]}"; do az monitor log-analytics query -w $logws_customer_id --analytics-query $src_query --query '[].SourceName' -o tsv; done)
    src_list=$(echo $src_list | sort -u)
    # echo "Source list: $src_list"
    echo "Getting destinations..."
    dst_query="NWConnectionMonitorTestResult | where TimeGenerated > ago(1h) | distinct DestinationName"
    dst_list=$(for logws_customer_id in "${logws_customer_id_list[@]}"; do az monitor log-analytics query -w $logws_customer_id --analytics-query $dst_query --query '[].DestinationName' -o tsv; done)
    dst_list=$(echo $dst_list | sort -u)
    # echo "Destination list: $dst_list"
    echo "Getting test configurations..."
    cfg_query="NWConnectionMonitorTestResult | where TimeGenerated > ago(1h) | distinct TestConfigurationName"
    cfg_list=$(for logws_customer_id in "${logws_customer_id_list[@]}"; do az monitor log-analytics query -w $logws_customer_id --analytics-query $cfg_query --query '[].TestConfigurationName' -o tsv; done)
    cfg_list=$(echo $cfg_list | sort -u)
    # echo "Configuration list: $cfg_list"
    # Get connectivity data with a union query to all workspaces
    if (( ${#logws_customer_id_list[@]} == 1 )); then
        line1='NWConnectionMonitorTestResult'
    else
        line1='union '
        for logws_customer_id in "${logws_customer_id_list[@]}"; do
            if [[ "$line1" != "union " ]]; then
                line1+=', '
            fi
            line1+='workspace("'$logws_customer_id'").NWConnectionMonitorTestResult'
        done
    fi
    line2="| where TimeGenerated > ago($interval) | project SourceName, DestinationName, TestResult, TestConfigurationName | summarize Pass=countif(TestResult == \"Pass\"), NoPass=countif(TestResult != \"Pass\") by SourceName, DestinationName, TestConfigurationName | project PassPercent=Pass/(Pass+NoPass), SourceName, DestinationName, TestConfigurationName"
    query="${line1} ${line2}"
    monitor_json=$(az monitor log-analytics query -w $logws_customer_id --analytics-query $query -o json)
    # For each source, print the latest results to the destination. Do a separate table per configuration test
    cfgs=''
    while IFS= read -r cfg
    do
        if [[ -n "$cfgs" ]]; then
            cfgs+='/'
        fi
        cfgs+="$cfg"
    done <<< "$cfg_list"
    echo " **** Test configurations: $cfgs ****"
    printf "%${table_width}s" "Source"
    while IFS= read -r dst
    do
        printf "%${table_width}s" $dst
    done << ago($interval) | where SourceName==\"$src\" and DestinationName == \"$dst\" and TestConfigurationName == \"$cfg\" | project TestResult | summarize Pass=countif(TestResult == \"Pass\"), NoPass=countif(TestResult != \"Pass\") | project PassPercent=Pass/(Pass+NoPass)"
                # # Browse over the workspaces until something other than "None" arrives
                # pass_percent="None"
                # for logws_customer_id in "${logws_customer_id_list[@]}"
                # do
                #     if [[ "$pass_percent" == "None" ]]
                #     then
                #         # echo "**DEBUG*** Sending query $pass_query to workspace $logws_customer_id..."
                #         pass_percent=$(az monitor log-analytics query -w $logws_customer_id --analytics-query $pass_query --query '[].PassPercent' -o tsv)
                #     fi
                # done
                results=''
                while IFS= read -r cfg
                do
                    if [[ -n "$results" ]]; then
                        results+='/'
                    fi
                    pass_percent=$(echo $monitor_json | jq -r '.[] | select(.SourceName == "'$src'") | select(.DestinationName == "'$dst'") | select(.TestConfigurationName == "'$cfg'") | .PassPercent')
                    if [[ -z "$pass_percent" ]]; then
                        pass_percent='No Data'
                    fi
                    results+="$pass_percent"
                done <<< "$cfg_list"
                printf "%${table_width}s" "$results"
            else
                printf "%${table_width}s" "N/A"
            fi
        done <<< "$dst_list"
        printf "\n"
    done <<< "$src_list"
}
monitor_results
Again, some highlights:
- I group the code in a shell function, so that whenever I want to get the latest results I just call the function
monitor_results - The list of sources, destinations and test configurations is retrieved from the latest hour of the logs
- The results are collected for the last 5 minutes, although I put that in a variable to make it shorter or longer
- The locations to look for existing connection monitors are specified in an array. Then the workspaces and workspace IDs in those locations will be identified, where the connection monitor test results are stored
- If there is more than one workspace, this is the syntax of the cross-workspace query that is sent out (in this example with two workspaces). The result will be stored in JSON, and processed for getting the value of each cell with jq (much more efficient than sending a query per cell):
union workspace("11111111-1111-1111-1111-111111111111").NWConnectionMonitorTestResult, workspace("22222222-2222-2222-2222-222222222222").NWConnectionMonitorTestResult
| where TimeGenerated > ago(5m)
| project SourceName, DestinationName, TestResult, TestConfigurationName
| summarize Pass=countif(TestResult == "Pass"), NoPass=countif(TestResult != "Pass") by SourceName, DestinationName, TestConfigurationName
| project PassPercent=Pass/(Pass+NoPass), SourceName, DestinationName, TestConfigurationName
As you can see, the “0” and “1” in the connectivity array display is actually the ratio of the passed tests as compared to the total tests performed, so “1” actually means “100% tests passed”.
And that’s it! After creating your networking topology you can easily see if all is working as it should in one proverbial “single pane of glass”:
**** Test configurations: Http/Icmp ****
      Source  branch1-vm  branch2-vm  spoke11-vm  spoke12-vm  spoke13-vm  spoke14-vm spoke141-vm spoke142-vm  spoke21-vm  spoke22-vm  spoke23-vm  spoke24-vm spoke241-vm spoke242-vm   ubuntucom
  branch1-vm         N/A         1/1         1/1         1/1         1/1         1/0         1/0         1/0         1/1         1/1         1/1         1/0         1/0         1/0         0/0
  branch2-vm         1/1         N/A         1/1         1/1         1/1         1/0         1/0         1/0         1/1         1/1         1/1         1/0         1/0         1/0         0/0
  spoke11-vm         1/1         1/1         N/A         1/1         1/1         1/0         1/0         1/0         1/1         1/1         1/1         1/0         1/0         1/0         1/1
  spoke12-vm         1/1         1/1         1/1         N/A         1/1         1/0         1/0         1/0         1/1         1/1         1/1         1/0         1/0         1/0         1/1
  spoke13-vm         1/1         1/1         1/1         1/1         N/A         1/0         1/0         1/0         1/1         1/1         1/1         1/0         1/0         1/0         1/1
  spoke14-vm         1/1         1/1         1/1         1/1         1/1         N/A         1/1         1/1         1/1         1/1         1/1         1/0         1/0         1/0         1/1
 spoke141-vm         1/0         1/0         1/0         1/0         1/0         1/0         N/A         1/0         1/0         1/0         1/0         1/0         1/0         1/0         0/0
 spoke142-vm         1/0         1/0         1/0         1/0         1/0         1/0         1/0         N/A         1/0         1/0         1/0         1/0         1/0         1/0         0/0
  spoke21-vm         1/1         1/1         1/1         1/1         1/1         1/0         1/0         1/0         N/A         1/1         1/1         1/0         1/0         1/0         1/1
  spoke22-vm         1/1         1/1         1/1         1/1         1/1         1/0         1/0         1/0         1/1         N/A         1/1         1/0         1/0         1/0         1/1
  spoke23-vm         1/1         1/1         1/1         1/1         1/1         1/0         1/0         1/0         1/1         1/1         N/A         1/0         1/0         1/0         1/1
  spoke24-vm         1/1         1/1         1/1         1/1         1/1         1/0         1/0         1/0         1/1         1/1         1/1         N/A         1/1         1/1         1/1
 spoke241-vm         1/0         1/0         1/0         1/0         1/0         1/0         1/0         1/0         1/0         1/0         1/0         1/0         N/A         1/0         0/0
 spoke242-vm         1/0         1/0         1/0         1/0         1/0         1/0         1/0         1/0         1/0         1/0         1/0         1/0         1/0         N/A         0/0
I hope this will make your Azure network testing a bit more efficient, thanks for reading!

Really useful blog. A suggest.. perhaps have a plugin that zooms the images as some are really small and it can be hard to see the text.
LikeLike
Thanks Karim, happy you like this! You are not the first one with that feedback, I need to consider whether moving up to the WordPress premium sku that supports plugins, or maybe even hosting this on my own. In the meantime, zooming in with the browser zooms seems to have helped others…
LikeLike