
You probably know Azure Log Analytics: a log repository and analysis system in Azure Monitor able to process millions of logs with queries that produce results in multiple formats, such as tables or charts.
Before I start, a brief note about nomenclature: Azure Log Analytics used to be an Azure service of its own, optionally bundled with other Azure services in the Operations Management Suite (OMS). OMS was discontinued, and Log Analytics is now one of the moving parts of Azure Monitor. During the rest of the post I will mainly speak of Log Analytics and Azure Monitor indistinctly.
One of the great things of Log Analytics is that you can define alerts based on the results of queries. These alerts can send an standard email message with some information about that alert, or can trigger a Logic App for a tighter control on the contents of that email. See this blog for more information about how to do that.
However in this post I will take a slightly different approach: we want to run periodically or on-demand a set of queries to Azure Monitor, and send the results per email as a report of sorts. My particular use case is the result of Azure Backup operations, but you can use this for many different purposes.
There are different automation tools in Azure: Azure Automation for Powershell runbooks, Azure Functions for event-triggered code in a number of programming languages, or Logic Apps for graphical workflows. I chose the latter due to the amount of existing connectors that make the definition of Logic App a breeze, without having to write a single line of code.
The very first thing you need to do is configuring your Azure resources to send data to Azure Monitor. You can do this typically from the Diagnostics settings of each Azure resource, or using the Azure CLI or Powershell. For example with CLI you can use the command az monitor diagnostic-setting create (see more about this command here). For more information on Azure resource diagnostic settings, have a look at this article.
The next thing you need is the query or queries that you want to perform. Queries are written with the Kusto Query Language (KQL), but you probably already know that, so let us jump to the meat.
You can now create an empty Logic App, and define your trigger: either a periodic schedule, or an HTTP request to be able to trigger your Logic App from any HTTP client. Next, we will use the new Logic App connector for Log Analytics. This connectors supports two modes: text (or table) and chart queries. Let’s start with the first.
Table Queries
For a text query (no chart) you will use the connector “Run Query and List Results“. Here you can see that the configuration is pretty straightforward: you need to authenticate to Azure, select the target Log Analytics Workspace, and paste the query you would like to run:

Ignore the content of the query, it is only important that it returns a table with a series of fields. If you run the Logic App and see the output of this action, you will see that it is a JSON object “value” containing a list of the rows of the query results:

My requirement was creating a list of the Virtual Machines (field VMName) and enhance them with a HTML hyperlink that would take the recipient of the email to the right place in Azure to get more information about the error (for which I need the resource group and subscription of the VM). I will use the Data Operations of Logic Apps, which allow for very rich data handling (see here for more information on Logic Apps Data Operations). In my case, I created a variable that contain the HTML code that I will put in the email message, and for every record I append new HTML code to it. The first thing is initializing the variable, that will be named VMlist:

As you see, I will use an HTML unsorted list (<ul>), with one list item (<li>) per each query result. Next comes a for loop with the data operations:
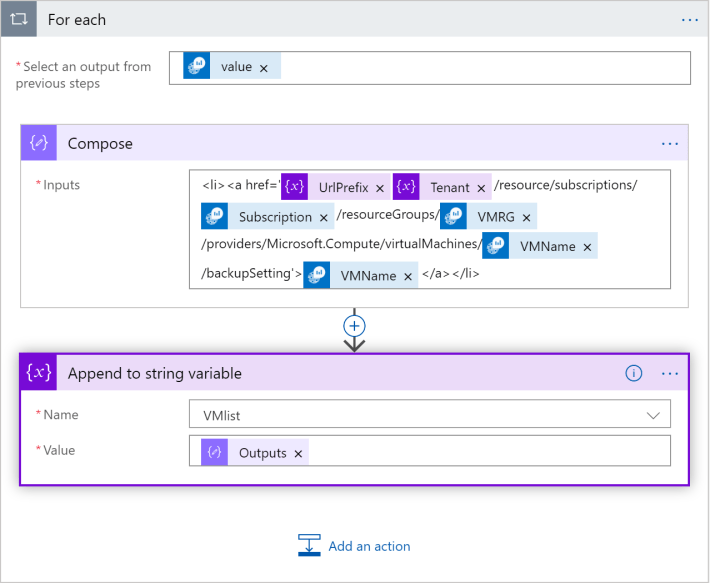
The input of the For each action block is the content of “value”, which is the list of records. Compose creates the <li> element putting the variables together with some static text to conform the URL of the link (that incidentally will take the user to the Backup settings of that specific VM), and the last block appends the result of Compose to the variable with the list of VMs.
There are two interesting things in the Compose block:
- I was not able to get the Tenant ID from the query, so I use a constant (a variable) with its value. Note that the variables need to be defined outside of the
For eachaction block. - The @ sign has a special meaning in Logic Apps, so I put it in another variable (along with all previous characters, which happen to be static) to prevent Logic Apps from trying to understand it:

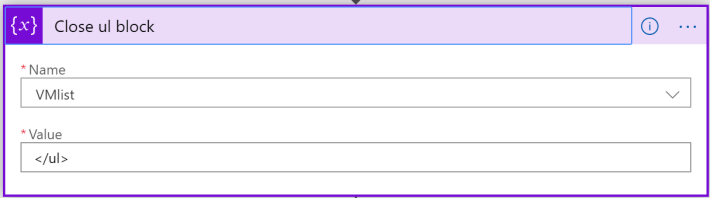
The only thing left is to close the <ul> block with another “Append to string variable” action (although I renamed it to something more descriptive for my Logic App):
Note that appending HTML code to a string is just one of the possibilities. If you do not need to modify the output of the query (for example to include links), an easier way would probably be running the KQL query with the “Run query and visualize results” action (see next section) and choose the “HTML table” output format. However, this was an interesting exercise that shows how to process and manipulate text query output if you need it.
Now we will see how to collect a graphical query, before putting everything into an email.
Chart Query
We go now for the element “Run query and visualize results” (again here I renamed the action element).
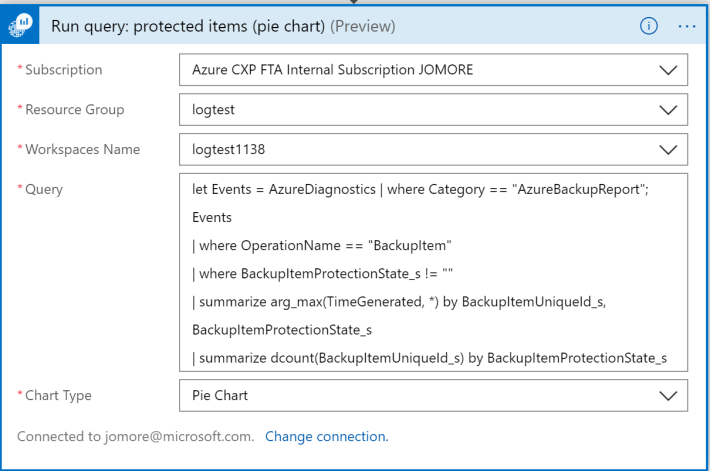
One remark here: you do not need to specify a render instruction in your KQL query, since you will hard wire the type of traffic you want to see in the Chart Type field of the connector. If you run the Logic App and see the output of this action, you should see something like this:

As you can see there is not one output, but three:
- Body: a Base64 text, that once decoded, gives you an important hint about how to use this output (see a bit later).
- Attachment Content: the binary representation of the image
- Attachment Name: the name given to the image file
First, let’s have a look at what the Body looks like:
$ body=PGJvZHkgc3R5bGU9J3RleHQtYWxpZ246Y2VudGVyOyc+PGltZyBzcmM9ImNpZDphaV9mbG93X2NoYXJ0XzIwMTkwNjMwMTAxNjI2LmpwZyIvPjxicj4=
$ echo $body | base64 -d
<body style='text-align:center;'><img src="cid:ai_flow_chart_20190630101626.jpg"/><br>
$
As you can see, it is just an HTML img tag that uses as source the name of the attachment.
Create the Email Message
Alright, we have now everything we need. You can now use the Office 365 Send Email action to create your email:

Note two important details:
- Whatever free text you put in the Body will be encoded in HTML. However, variables will not. In other words, if you type the
<img>HTML label in the email body, it will be handled as text (and not as HTML code). However, if instead you type it into a variable, and then you put the variable to the body, it will be correctly parsed. Hence, we create a variable calledimg, which is what appears in the body (see previous figure):

- For the
<img>HTML tag to work, there has to be an attachment with the same name. Note how the attachment is created with the outputs of the chart-based Log Analytics query.
You can now save and run your Logic App, and you should get an email similar to this:

Agreed, not spectacular, but as long as your HTML skills are better than mine, you should be able to easily create a decent layout containing multiple queries and charts from Log Analytics, optionally with clickable links, that can be sent via email to any number of users. I hope this was useful!

Nice article Jose! Btw long time we don’t speak, hope you well ciao luciano
LikeLike
This is not working in outlook365. the image is not getting embedded into Body. the is not working. can you suggest any fix for this?
LikeLike
Hey Anurag, thanks for looking into this. These days I am swamped with other stuff, I will try to find some time to test it!
LikeLike
Is there a way to take the base64 encoded version of the image and put that base64 string into an img tag so you don’t need to send it as an attachment with cid? Having it as an attachment is kinda weird to me and rendering works in Outlook, but might be different in other email clients.
LikeLike
That is a good idea! I havent tried it, but it sounds like a good plan
LikeLike
I was looking to do exactly this and came up with:
LikeLike
Hey Jeff, some parts of your comment got lost?
LikeLike
Hi, is there a way to customize the chart? i.e. set the colors we want to use
LikeLike
Yes I managed to do this. I adjusted the ‘img’ variable step
1. Remove the current value
2. Click insert expression
3. Click dynamic content and select the `AttachementContent`
4. Click `Add`
On the email step, enter the code view and add this`<img src=”data:image/jpg;base64,@{variables(‘Img’)}”>`
Make sure the variable step name is ‘img’ if copying/pasting directly from here.
Alternatively add `<img src=”data:image/jpg;base64, )}”>` and then insert the referenced variable from the UI
LikeLike
Good job, thanks Martin!
LikeLike