
OK, you have found this great new Azure Service. It does all you ever wanted, so after deciding you are going to use it in production, the next question pops up: how to monitor it?
The first immediate answer is that what Azure Monitor is there for! Which begs for the next question: what can you monitor with it?
In this post we are going to take Azure Key Vault as example, and go over some of Azure Monitor functionality, namely:
- Explore which logs and metrics are recorded by Azure Monitor.
- Create your own Kusto Query Language queries on the information recorded by Log Analytics (now “rebranded” as a component of Azure Monitor).
- Create a shareable Azure Dashboard that can be deployed as through an ARM template.
Well, first things first: you need to configure the basics: create the Azure resource you want to explore (Key Vault in this example), create a Log Analytics workspace, and configure your Key Vault to send diagnostics information to your newly created Log Analytics workspace.
Tip: you were probably going to do this anyway but still: you might want to create those two objects in their own Resource Group, so that you can delete everything when you do not need it any more.
Alright, now the fun part begins. You need to generate some load, so that you have some logs to look at at. The scripts in this Github repo can help with that, by continuously creating, reading and deleting secrets.
After generating load, you can go to the Log Analytics workspace and start exploring the logs. This is the way that I typically do it: first, I start with looking in which tables relevant logs are stored. You can use a query like this one:
search "*Vault*"
| summarize count() by $table
This query will give you the count of logs containing the string “Vault” in each table. You will see that you have logs in two tables: AzureDiagnostics and AzureMetrics.
You can keep on exploring each table. If you remove the summarize line from the previous query, you get to see the full logs, including the field names. A next step might be this query:
AzureDiagnostics
| where ResourceProvider == "MICROSOFT.KEYVAULT"
| summarize count() by OperationName
Now this starts getting meaningful. You can explore different visualizations, including charts, and further refine your queries.
Creating Dashboards
Once you have identified useful queries, you can save them in your Log Analytics workspace. But you can expose those queries in a more consumable manner by means of a dashboard.
You can easily deploy dashboards with ARM templates. I “stole with pride” Rob Davies’ dashboard for Application Gateways, and adapted it for our Key Vault purpose. You can see the ARM template for a sample dashboard with KQL queries for Key Vault templates here. If you deploy the template, a dashboard like this would appear in your Azure Portal:
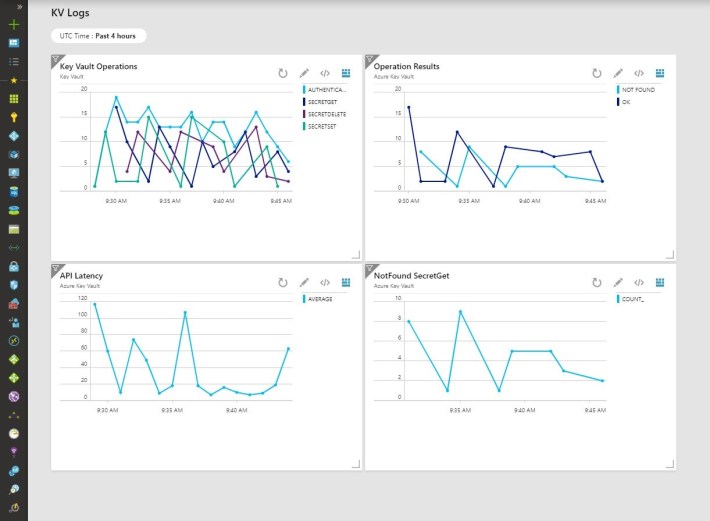
As you can see, the ARM code is relatively simple, and the dashboard has some “parts”. Each part is a widget you can place in the dashboard and size, as well as configure some parameters like the query to be supplied, or the aggregation scheme.
At the risk of being lengthy, here you have the example of one of these parts, corresponding to the KQL query that we saw above:
"0": {
  "position": {"x": 0, "y": 0, "rowSpan": 4, "colSpan": 6 },
  "metadata": {
    "inputs": [
      {
        "name": "ComponentId",
        "value": {
          "SubscriptionId": "[subscription().subscriptionId]",
          "ResourceGroup": "[parameters('logAnalyticsWorkspaceResourceGroup')]",
          "Name": "[parameters('logAnalyticsWorkspaceName')]"
        }
      },
      { "name": "Query", "value": "AzureDiagnostics\r\n| where ResourceProvider == \"MICROSOFT.KEYVAULT\"\r\n| summarize count() by OperationName,bin(TimeGenerated, 1m)\r\n| render timechart\r\n" },
      { "name": "TimeRange", "value": "PT1H" },
      {
        "name": "Dimensions",
        "value": {
          "xAxis": { "name": "TimeGenerated", "type": "DateTime" },
          "yAxis": [ { "name": "count_", "type": "Double" } ],
          "splitBy": [ { "name": "OperationName", "type": "String" } ],
          "aggregation": "Sum"
        }
      },
      { "name": "Version", "value": "1.0" },
      { "name": "DashboardId", "value": "[concat('/subscriptions/',subscription().subscriptionId,'/resourceGroups/',resourceGroup().Name,'/providers/Microsoft.Portal/dashboards/',variables('dashboardID'))]" },
      { "name": "PartId", "value": "[concat(uniquestring(variables('dashboardID')), 'Part2')]" },
      { "name": "PartTitle", "value": "Key Vault operations" },
      { "name": "PartSubTitle", "value": "Application Gateway" },
      { "name": "resourceTypeMode", "value": "workspace" }
    ],
    "type": "Extension/AppInsightsExtension/PartType/AnalyticsLineChartPart",
    "settings": {
      "content": { "dashboardPartTitle": "Key Vault Operations", "dashboardPartSubTitle": "Key Vault" }
    },
    "asset": { "idInputName": "ComponentId", "type": "ApplicationInsights" }
   }
 }
As you can see, the dashboard “part” contains some interesting elements as part of its inputs:
- Component ID: reference to the workspace
- Query: the most important part, contains the KQL query
- Time range
- Dimensions: contains the fields to be used for the different axes, and very importantly, any grouping that you wish to do. Obviously, the field names that are referenced here must exist in your KQL query
- Next you have other self-explanatory items, such as title/subtitle, and others.
You can click on the different dashboard items, and that will take you to the log analytics workspace.
I hope you could see in this post how you can easily start leveraging log analytics in order to create dashboards that will help you to better monitor your Azure assets.
Thanks for reading!
