
Ever since I started working in the server market around 8 years ago, I come across projects where physical or virtual machines need to be sized for an application with incomplete data. More often than not, sizing comes in the form “x cores at y GHz”. When I tell them that that information is not actually something with which I can do an exact sizing, but that I need the specific CPU model on which those “x cores” have been tested, people usually stare at me.
I will try to put it in a blog, so that you can redirect those staring looks to a Web page. The theory is pretty simple: CPU technology evolves, and cores running at the same speed do not necessarily deliver the same performance, if the hardware architectures they are based on are different.
To prove that, I have taken different CPUs of the past years (starting with Nehalem, that was the first one I had the pleasure to work with). I have taken a bunch of CPUs of different generations, all running at 2.0 GHz, and another lot running at 3.2GHz (roughly the upper and lower side of the spectrum for servers).
I have compared the CPUs to each other, measuring the performance per core. How to measure the performance of a CPU? Well, there are many benchmarks out there, but for an application-independent, objective performance assessment, I usually use the CINT and CFP benchmark results, available here: https://www.spec.org/cgi-bin/osgresults?conf=cpu2006.
In order to combine for the performance for integer operations (CINT) and floating point operations (CFP), I just add up both numbers. That gives generally a pretty good idea of the overall performance of the CPU. If you then divide through the total number of cores that benchmark was run with, voilà, you have the performance per core.
Let’s have a look at the 2.0GHz series, I have picked these CPUs:
| CPU (2.0GHz) | Year | CINT2006 (approx) | CFP2006 (approx) | #Cores/chip | #Chips | #Cores | CINT + CFP | Combined CINT + CFP @2.0Ghz |
| E5504 | 2009 | 21.5 | 26 | 4 | 2 | 8 | 47.50 | 5.94 |
| L5638 | 2010 | 29 | 35 | 6 | 2 | 12 | 64.00 | 5.33 |
| E7-2850 | 2011 | 31 | 47 | 10 | 2 | 20 | 78.00 | 3.90 |
| E5-2650 | 2012 | 45 | 75 | 8 | 2 | 16 | 120.00 | 7.50 |
| E7-4820v2 | 2014 | 40 | 77 | 8 | 4 | 32 | 117.00 | 3.66 |
| E5-2640v2 | 2013 | 43 | 75 | 8 | 2 | 16 | 118.00 | 7.38 |
| E7-4809v3 | 2015 | 38 | 78 | 8 | 4 | 32 | 116.00 | 3.63 |
| E5-2683v3 | 2015 | 55 | 103 | 14 | 2 | 28 | 158.00 | 5.64 |
| E5-2660v4 | 2016 | 65 | 111 | 14 | 2 | 28 | 176.00 | 6.29 |
As you can see in the table above, I have taken an approximate value for the CINT and CFP benchmark results, since for a given CPU a number of them exist (at least one per hardware vendor, with more or less “optimizations”). If you put that to a graph, this is the result:
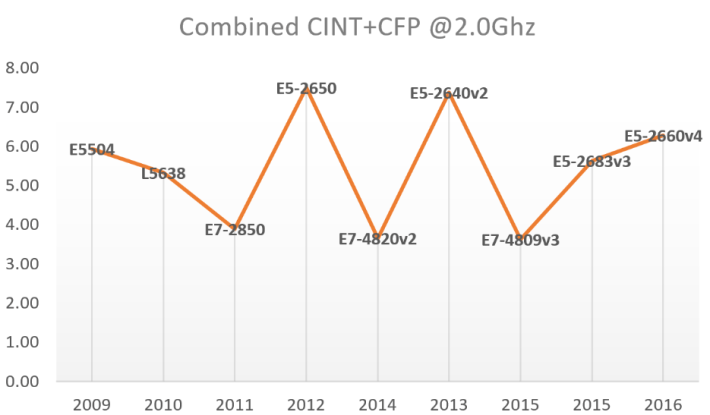
As you can see, the performance of a core can greatly vary depending on the CPU is based on. For example, if you have an old E7-2850, you will be at around 4 “performance units”. If however you take a modern E5-2660 v4, you will have around 50% more performance in your cores, so chances are you are wasting 50% of the money you put in your CPU.
We can have a look at similar data for 3.2GHz CPUs. Here you have the raw data:
| CPU (3.2GHz) | Year | CINT2006 (approx) | CFP2006 (approx) | #Cores / chip | #Chips | #Cores | CINT + CFP | Combined CINT+CFP @3.2Ghz |
| W5580 | 2009 | 36 | 41 | 4 | 2 | 8 | 77.00 | 9.63 |
| E7-8891v2 | 2014 | 64 | 113 | 10 | 4 | 40 | 177.00 | 4.43 |
| E7-8893v3 | 2015 | 64 | 110 | 4 | 4 | 16 | 174.00 | 10.88 |
| E5-2667v3 | 2015 | 66 | 121 | 8 | 2 | 16 | 187.00 | 11.69 |
| E5-2667v4 | 2016 | 72 | 128 | 8 | 2 | 16 | 200.00 | 12.50 |
And here the graph:

I like this latest graph because it shows the trend Intel is following with their server CPUs. Taking out the W5580 (which is actually a Workstation CPU, that is what the “W” stands for), Intel has been consistently delivering more performance per core. You could argue that I am mixing up apples and oranges (E5 and E7 CPUs) in the same graph, but the numbers add up pretty nicely 🙂
Now you probably understand why in Microsoft Azure we don’t necessarily use the GHz in order to measure the performance of our cores, but something called “ACU” (Azure Compute Unit, see here for more information: https://docs.microsoft.com/en-us/azure/virtual-machines/virtual-machines-windows-acu). We took as reference the cores that you find in the A1 VMs, which by the way seems to be based on Intel E5-2660 CPUs:
$ cat /proc/cpuinfo | grep 'model name' | uniq
model name : Intel(R) Xeon(R) CPU E5-2660 0 @ 2.20GHz
You could ask: why didn’t you take the CINT benchmark, or the CFP benchmark? Well, the problem with those benchmarks is that there is a lot of engineering involved. If you would just run the benchmark on a server out of the box, you would never get to the results in the spec.org site. That is because server vendors tune every single aspect of the system, including BIOS, memory types and access, disks, etc. It would be like trying to compete on a rally with your street car.
However, in Azure we run the ACU tests on exactly the same cores as you are going to get, so we wanted something more realistic. And to be honest, if we run the CINT benchmark but get a lower value than in the benchmark-optimized tests that the server vendors run, guess what is the first question that customers are going to ask.
Furthermore, we include in those performance tests not only integer and floating-point operations, but more things like for example memory speed or throughput. That is the primary reason why Microsoft came up with our own CPU benchmark.
But ACUs were not the main reason why I wrote this up: I hope that the next time that you need to size the compute for your application, you will not use just the number of cores and their frequency.
