
You might have heard about the General Availability of Virtual Network Flow Logs in Azure, and even read the announcement blog post. When writing that post with Harsha CS I had the chance to play a bit with VNet Flow Logs and Traffic Analytics, and I would like to share some of the learnings.
What the heck am I talking about? Let me bring you up to speed very quickly (attention, oversimplification ahead!): NSG Flow Logs is a technology that logs every packet going through an NSG: in and out, allowed and dropped. The main issue of NSG Flow Logs is, well, that you need an NSG, and some resources in Azure do not support them. For example, Azure Firewall, VPN gateways or ExpressRoute gateways. Enter VNet Flow Logs, which you can enable in a whole VNet or subnet, regardless of whether there are NSGs or not.
What is Traffic Analytics, I hear you say? VNet Flow Logs are stored in Azure Blob Storage. Optionally, you can enable Traffic Analytics, which will do two things: it will enrich the flow logs with additional information, and will send everything to a Log Analytics Workspace for easy querying. This “enrich and forward to Log Analytics” operation will happen in intervals, either every 10 minutes or every hour.
VNet Flow Logs give you much more, such as for example whether traffic is vnet-encrypted or not, whether traffic is dropped by AVNM security admin rules, and some more stuff, but you will find all that in the docs so I am not going to repeat it here.
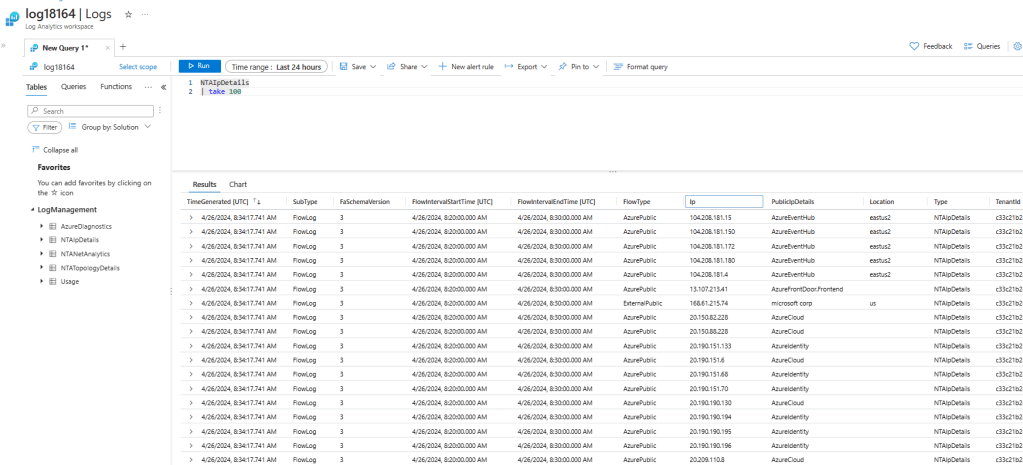
Table structure: NTAIpDetails
This table will contain some enrichment data about public IP addresses, including whether they belong to Azure services and their region, and geolocation information for other public IPs. Here you can see a sample of what that table looks like:
For example, looking at the NTAIpDetails table you could extract information about what communications are there in place. The query is very simple (NTAIpDetails | distinct FlowType, PublicIpDetails, Location), and it gives you a glimpse of what you can do, especially when joining this table to NTANetAnalytics (see the scenarios further down for examples on how to join this table):
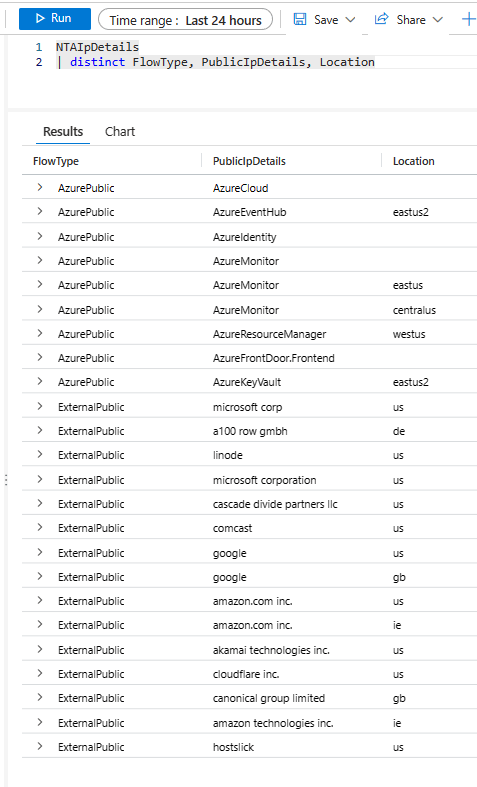
NTAIpDetails
| distinct FlowType, PublicIpDetails, Location
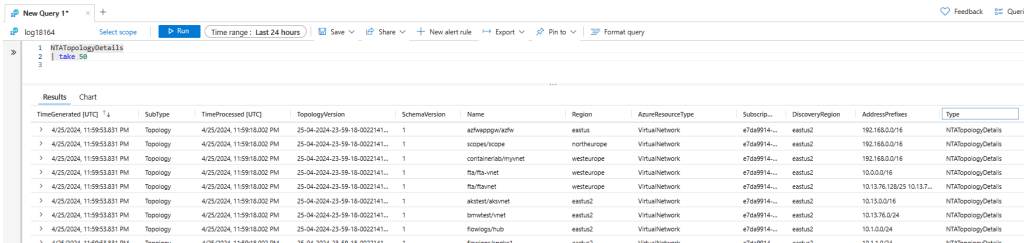
Table structure: NTATopologyDetails
This table contains information about different elements of your topology, including VNets, subnets, route tables, routes, NSGs, Application Gateways and much more. Here you cans see what it looks like:
For example, with a simple query you can get the routes in the route tables configured in a given resource group:
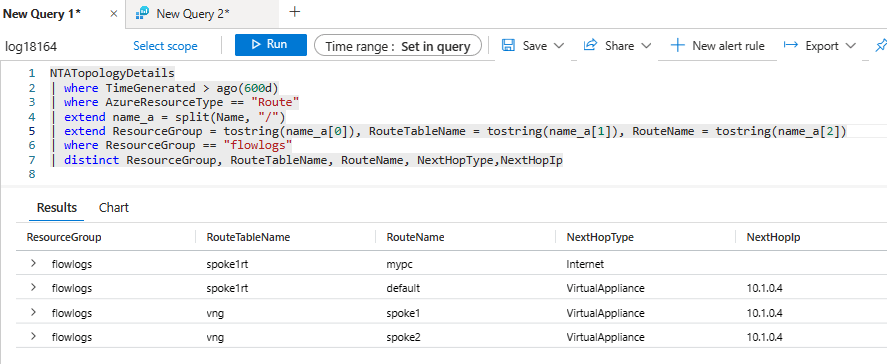
NTATopologyDetails
| where TimeGenerated > ago(600d)
| where AzureResourceType == "Route"
| extend name_a = split(Name, "/")
| extend ResourceGroup = tostring(name_a[0]), RouteTableName = tostring(name_a[1]), RouteName = tostring(name_a[2])
| where ResourceGroup == "flowlogs"
| distinct ResourceGroup, RouteTableName, RouteName, NextHopType,NextHopIp
Yeah, there are many other ways of getting topology information in Azure, such as with Azure Resource Graph, but having this in a table is pretty handy to do join queries.
Table structure: NTANetAnalytics
Alright, now we are coming to more interesting things: this table is the one containing the flows we are looking for. Records in this table will contain the usual attributes you would expect such as source and destination IP, protocol, and destination port. Additionally, data will be enriched with information such as:
- Source and destination VM
- Source and destination NIC
- Source and destination subnet
- Source and destination load balancer
- Flow encryption (yes/no)
- Whether the flow is going over ExpressRoute
- And many more
Further below you can read some scenarios with detailed queries that will show you some examples of ways you can extract information from VNet Flow Logs and Traffic Analytics. Of course, these are just some of the scenarios that came to mind on my topology, the idea is that you can get inspiration from these queries to support your individual use case.
Scenario 1: traffic to/from a virtual machine
For example, imagine you want to see with which IP addresses a given virtual machine has been talking to in the last few days:

NTANetAnalytics
| where TimeGenerated > ago(60d)
| where SrcIp == "10.1.1.8" and strlen(DestIp)>0
| summarize TotalBytes=sum(BytesDestToSrc+BytesSrcToDest) by SrcIp, DestIp
What if we want to enrich this information with the NTAIpDetails table to get the geolocation of the public IP addresses? Let’s have a look:
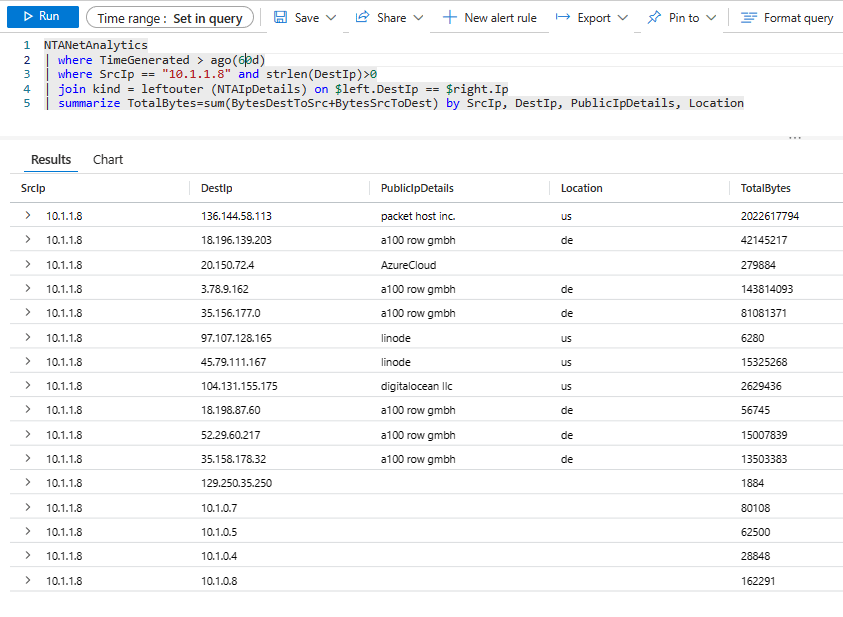
NTANetAnalytics
| where TimeGenerated > ago(60d)
| where SrcIp == "10.1.1.8" and strlen(DestIp)>0
| join kind = leftouter (NTAIpDetails) on $left.DestIp == $right.Ip
| summarize TotalBytes=sum(BytesDestToSrc+BytesSrcToDest) by SrcIp, DestIp, PublicIpDetails, Location
Mmmh, that packet host inc. looks suspicious, so now you might be interested in getting a time distribution on the protocols that have been going on there. Nothing easier! We can see here that there have been two big data transfers of around 1GB in two different days, the last one on 23rd April.

NTANetAnalytics
| where TimeGenerated > ago(60d)
| where SrcIp == "10.1.1.8" and DestIp == "136.144.58.113"
| join kind = leftouter (NTAIpDetails) on $left.DestIp == $right.Ip
| extend App = strcat(L4Protocol,tostring(DestPort))
| summarize TotalBytes=sum(BytesDestToSrc+BytesSrcToDest) by App, bin(TimeGenerated, 1d)
| render columnchart
Mmmmh, somebody exfiltrating data?
Scenario 2: load balancer traffic distribution
You want to look into the traffic distribution of a given application front-ended by a load balancer? Two of the enrichment fields in the NTANetAnalytics table are SrcLoadBalancer and DestLoadBalancer, that we can leverage for this purpose. We will look at the source IP first, meaning traffic going from the VM to the load balancer:

NTANetAnalytics
| where SubType == 'FlowLog' and TimeGenerated > ago(60d)
| where SrcLoadBalancer contains 'web' or DestLoadBalancer contains 'web'
| summarize TotalBytes = sum(BytesSrcToDest + BytesDestToSrc) by tostring(SrcIp)
| render piechart
Interesting, it looks like 10.1.1.70 is not getting too much traffic? Let’s look here to the time distribution as well, maybe that machine hasn’t been there for a long time:

NTANetAnalytics
| where SubType == 'FlowLog' and TimeGenerated > ago(60d)
| where SrcLoadBalancer contains 'web' or DestLoadBalancer contains 'web'
| summarize TotalBytes = sum(BytesSrcToDest + BytesDestToSrc) by tostring(SrcIp), bin(TimeGenerated, 1d)
| render barchart
We can have a look at the Destination IP as well, which will show an interesting picture:

NTANetAnalytics
| where SubType == 'FlowLog' and TimeGenerated > ago(60d)
| where SrcLoadBalancer contains 'web' or DestLoadBalancer contains 'web'
| summarize TotalBytes = sum(BytesSrcToDest + BytesDestToSrc) by tostring(DestIp), bin(TimeGenerated, 1d)
| render barchart
Wow, it looks like we need to have a look at these VMs, something seems not to be right with our load distribution!
Scenario 3: Traffic between IP ranges
Traffic Analytics will enrich the information with information such as source and destination subnets:
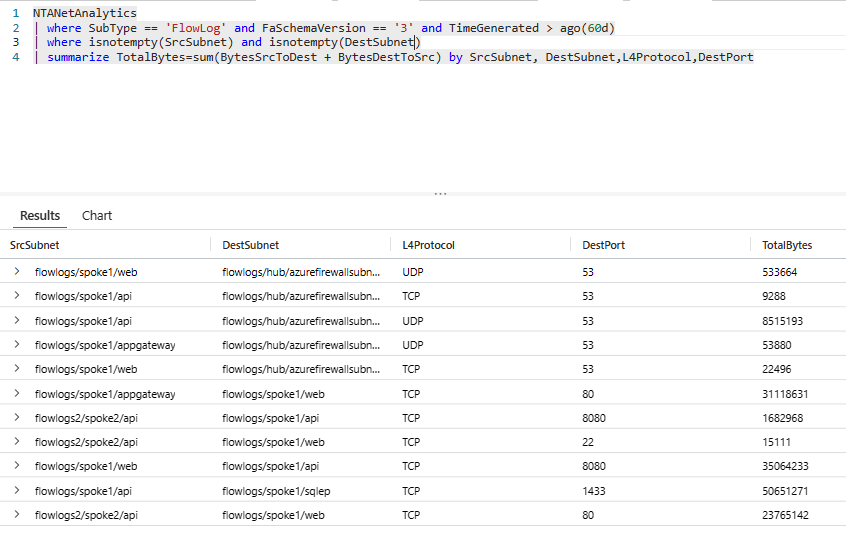
NTANetAnalytics
| where SubType == 'FlowLog' and FaSchemaVersion == '3' and TimeGenerated > ago(60d)
| where isnotempty(SrcSubnet) and isnotempty(DestSubnet)
| summarize TotalBytes=sum(BytesSrcToDest + BytesDestToSrc) by SrcSubnet, DestSubnet,L4Protocol,DestPort
However, sometimes you want to do a different data aggregation, for example if you would like to see traffic between on-premises and Azure. In this case you can define the aggregation prefixes yourself and use the handy KQL function ipv4_is_in_range:

let prefix1="10.1.1.0/27";
let prefix2="10.1.1.64/27";
NTANetAnalytics
| where SubType == 'FlowLog' and FaSchemaVersion == '3' and TimeGenerated > ago(30d)
| extend SrcIpIsInPrefix1 = ipv4_is_in_range(SrcIp, prefix1), SrcIpIsInPrefix2 = ipv4_is_in_range(SrcIp, prefix2)
| extend DestIpIsInPrefix1 = ipv4_is_in_range(DestIp, prefix1), DestIpIsInPrefix2 = ipv4_is_in_range(DestIp, prefix2)
| where (SrcIpIsInPrefix1 and DestIpIsInPrefix2) or (SrcIpIsInPrefix2 and DestIpIsInPrefix1)
| summarize TotalBytes=sum(BytesSrcToDest + BytesDestToSrc) by SrcIp, DestIp,L4Protocol,DestPort,L7Protocol
You want this information but distributed across time, to have a look at traffic evolution? You got it. We can create a new field to aggregate the information about source, destination and protocol, and represent to a stacked chart:
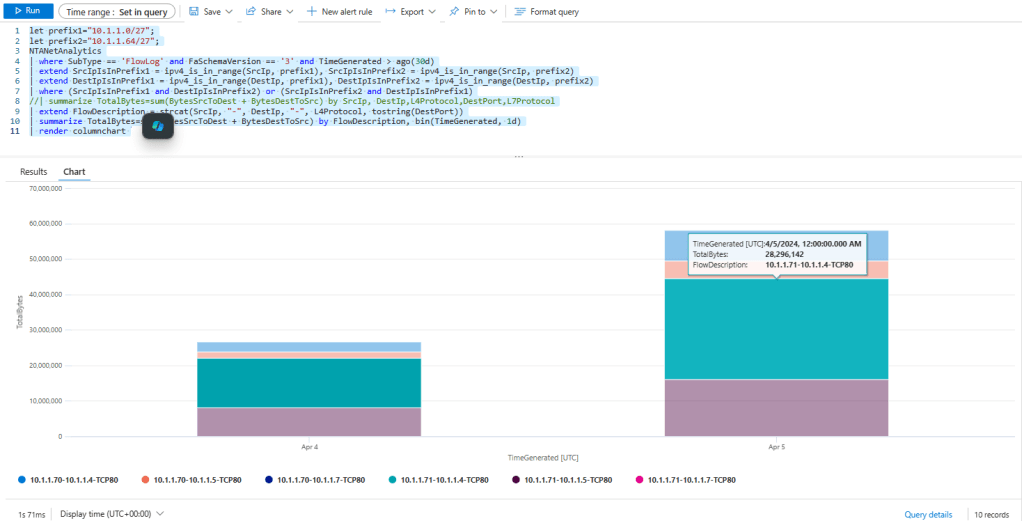
let prefix1="10.1.1.0/27";
let prefix2="10.1.1.64/27";
NTANetAnalytics
| where SubType == 'FlowLog' and FaSchemaVersion == '3' and TimeGenerated > ago(30d)
| extend SrcIpIsInPrefix1 = ipv4_is_in_range(SrcIp, prefix1), SrcIpIsInPrefix2 = ipv4_is_in_range(SrcIp, prefix2)
| extend DestIpIsInPrefix1 = ipv4_is_in_range(DestIp, prefix1), DestIpIsInPrefix2 = ipv4_is_in_range(DestIp, prefix2)
| where (SrcIpIsInPrefix1 and DestIpIsInPrefix2) or (SrcIpIsInPrefix2 and DestIpIsInPrefix1)
//| summarize TotalBytes=sum(BytesSrcToDest + BytesDestToSrc) by SrcIp, DestIp,L4Protocol,DestPort,L7Protocol
| extend FlowDescription = strcat(SrcIp, "-", DestIp, "-", L4Protocol, tostring(DestPort))
| summarize TotalBytes=sum(BytesSrcToDest + BytesDestToSrc) by FlowDescription, bin(TimeGenerated, 1d)
| render columnchart
Interesting, a lot of traffic on port 80, maybe somebody should look at migrating to HTTPS?
Scenario 4: ExpressRoute traffic
You know that VNet Flow Logs are not tied to NSGs as we saw in the previous scenario about Azure Firewall. Guess what, this applies as well to VPN and ExpressRoute gateways. More concretely, with ExpressRoute we can even leverage the fields SrcExpressRouteCircuit and DestExpressRouteCircuit:
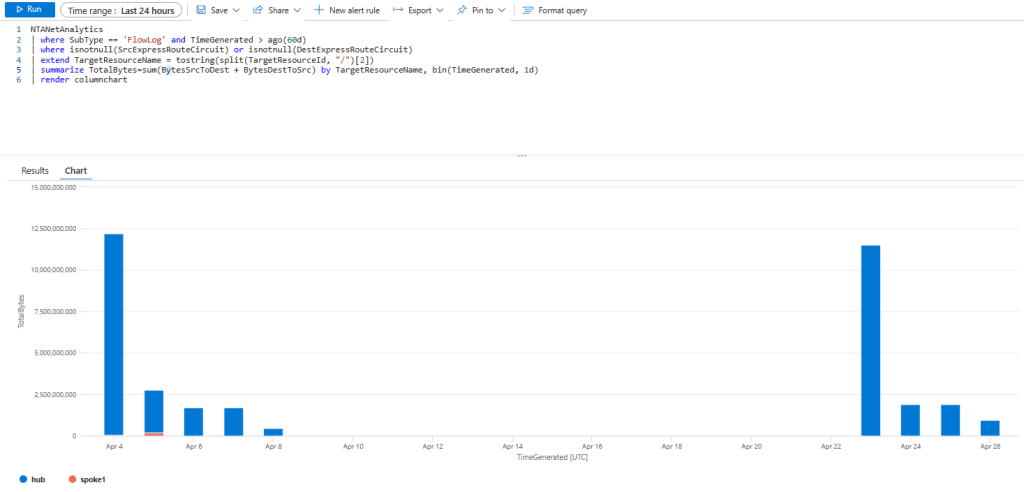
NTANetAnalytics
| where SubType == 'FlowLog' and TimeGenerated > ago(60d)
| where isnotnull(SrcExpressRouteCircuit) or isnotnull(DestExpressRouteCircuit)
| extend TargetResourceName = tostring(split(TargetResourceId, "/")[2])
| summarize TotalBytes=sum(BytesSrcToDest + BytesDestToSrc) by TargetResourceName, bin(TimeGenerated, 1d)
| render columnchart
We can use the previous recipe for prefix aggregation to show traffic from onprem to Azure and Azure to onprem:

let prefix1="10.4.0.0/16";
let prefix2="10.1.0.0/16";
NTANetAnalytics
| where SubType == 'FlowLog' and FaSchemaVersion == '3' and FlowStartTime > ago(24h)
| extend SrcIpIsInPrefix1 = ipv4_is_in_range(SrcIp, prefix1), SrcIpIsInPrefix2 = ipv4_is_in_range(SrcIp, prefix2)
| extend DestIpIsInPrefix1 = ipv4_is_in_range(DestIp, prefix1), DestIpIsInPrefix2 = ipv4_is_in_range(DestIp, prefix2)
| where (SrcIpIsInPrefix1 and DestIpIsInPrefix2) or (SrcIpIsInPrefix2 and DestIpIsInPrefix1)
| extend Direction = iff((SrcIpIsInPrefix1 and DestIpIsInPrefix2), "Onprem2Azure", "Azure2Onprem")
| summarize TotalBytesSrcToDest=sum(BytesSrcToDest), TotalBytesDestToSrc=sum(BytesDestToSrc) by Direction
| render columnchart
Conclusion
These were only some examples of how you can slice and dice the data in VNet Flow Logs, please do not hesitate to let me know in the comments about other cool KQL queries you are using!

Hi Cloudtrooper ,Thanks for sharing your findings and use of VNET Flow logs.Can we save logs on premises for historical data and analysis. Regards Irshad Alam
LikeLike
You can certainly download the logs from the storage accounts, or export the Traffic Analytics data as described in https://learn.microsoft.com/azure/azure-monitor/logs/logs-data-export
LikeLike
Does Traffic Analytics process all Flow Logs on the Storage Account (retrospective) or only for “new” Flow Logs?
LikeLike
Not sure I understand what you mean. Do you refer to NSG vs VNet flow logs? If so yes, both are supported by Traffic Analytics.
Or do you mean when you enable TA after you already have some flows in the storage account? If so, the answer is only from the time you enable TA.
LikeLike
The latter. The question is can I in the first step collect flow logs (at low costs) and then apply TA to existing logs if necessary (problem / attack happened)?
LikeLike
[…] might have heard about VNet Flow Logs, I posted about this new Azure feature here. One of the applications of VNet Flow Logs is to gain visibility into traffic in places that had […]
LikeLike
This was a limitation with NSG flow logs
Traffic to a private endpoint
Traffic to private endpoints can only be captured at source VM. The traffic is recorded with source IP address of the VM and destination IP address of the private endpoint. Traffic can’t be recorded at the private endpoint itself due to platform limitations.
—————This is a limitation with vnet flow logs as well ? I still observe the same behavior
LikeLike
Yes. The private endpoint doesn’t actually “exist”, packets go straight from the client VM to the PaaS service (or Private Link Service). Consequently, the only point where you can use Flow Logs is in the source NIC.
I don’t think that has changed between NSG and VNet Flow Logs, good catch.
LikeLike
I have enabled flow logs at the vnet level , the flows work fine and I am able to check that via my vnet flow logs on that vnet , but I see that “TargetResourceId”: “-” is always empty in my json , but when I check the same flow in traffic analytics , I am able to see the correct TargetResourceId. I see TargetResourceId is empty in all my jsons till date . Am I missing something here , why is it empty ? Is the NTANetAnalytics based on this json?
LikeLike
Yes, NTANetAnalytics is based on the JSON, but contains additional details enriched by Traffic Analytics.
LikeLike
Hello Jose .. thank you for your help on earlier queries and this blog is really helpful. Do you think I can use the following query to find all the traffic going from my ER gateway towards Internet using a query like one below? Basically we are trying to find out the Bandwidth used for internet as we want to put a FW soon and this information on bandwidth used for internet is going to be very helpful. Do you think a query like one below help me gather that info?
LikeLike
Hey Rahul, sorry for not having approved this comment earlier, for some reason it went through the cracks and didn’t notice it until today. To your query, instead of string functions you might want to use the Kusto functions ipv4_is_in_range or ipv4_is_in_any_range (https://learn.microsoft.com/kusto/query/ipv4-is-in-any-range-function). Hth!
LikeLike
Complete side note.. Tapping of PaaS traffic (assumption) is not possible due to how they are setup, so to get that insight Vnet Flow Logs / NSG Flow logs would be the solution?
LikeLike
Hey Ulv! I am not sure if VNet Flow Logs support private endpoints already, I can’t seem to find it in https://learn.microsoft.com/azure/network-watcher/vnet-flow-logs-overview. The good thing about VNet Flow Logs is that recording at the origin is much easier now, for example at the central firewall or on the ExR/VPN gateways.
LikeLike
[…] might have heard about VNet Flow Logs, I posted about this new Azure feature here. One of the applications of VNet Flow Logs is to gain visibility into traffic in places that had […]
LikeLike
Hi Jose, thank you for responding to my earlier comment. I wanted to ask another question related to Round Trip time (RTT) in a scenario where we have Database vnet, App Vnet and then we have NVA (Hub vnet). Anytime App Vnet makes call to Db in db vnet, it passes thru NVA in hub vnet. Now if Vnet flow logs is enabled in all the vnets here is it possible to find out round trip time when App makes the request to db and this request passes thru NVA (i.e. hub vnet).
From your queries above I tried following but was not sure if this is correct want to get the min, max and avg time in milliseconds and wasn’t even sure if there is a way to get RTT as there is no co-relation to find the return flow (or may be I am thinking it wrong). Any idea on how I can get this from Vnet flow logs (basically I am trying to get some Performance numbers on network level thru this to see how the overall performance when the flow traverses from app (vnet)–>NVA (Hub)–>Db (vnet) (all in Azure). here is my sample query based on your work above where prefix1 is App vnet and prefix 2 is Dbvnet. Any help? Thank you
LikeLike
Hey there! I haven’t tested in depth, but I remember not being able to measure latency with the Flow Logs timestamps. You might be better off using tcping or mrt to measure latency.
LikeLiked by 1 person
Thank you Jose. yes sir we used Socperf to test the latency between VMs but I was thinking if at all I can leverage Vnet flow logs to measure response times (between App VM flow intiation to Db VM flow). I mean Socperf helped to understand latency with NVA was hardly 980ms and without NVA was about 600ms (when both DB and App Vnets were peered). Under load the app is really cracking up and response times getting bad (I totally agree that app logs or something like application insights can give more clarity but unfortunately this is old legacy app ported to Azure IaaS so that integration is not there).
I guess may be Vnet flow logs wont help (as I think you pointed in above) for response time measuring as corelation is not maintained. Thank you again for writing these wonderful blogs which really help us give a lot of insights, I really appreciate all the hardwork you put into thinking and writing these.
LikeLiked by 1 person
You might try with the source port if the NVA is not SNATting, othewise you would have to correlate with the SNAT logs It is a good question whether the timestamps of the flow logs are accurate enough to measure latency, I don’t know the answer to that.
LikeLike
[…] If you have been reading my blog, you are probably familiar with Flow Logs. Back in the day I blogged about how to use NSG Flow Logs to detect traffic anomalies, about different ways to access NSG Flow Logs, and more recently about the main functional differences between VNet FLow Logs and ExpressRoute Traffic Collector as well as some sample queries to query VNet Flow Logs, […]
LikeLike
[…] when VNet Flow Logs were launched I blogged about some recipes that help to extract insights out of the different information fields contained in the Flow Logs. […]
LikeLike
[…] when VNet Flow Logs were launched I blogged about some recipes that help to extract insights out of the different information fields contained in the Flow Logs. […]
LikeLike
Hi Jose,
Would that be correct that it is not possible to use VNet flow logs in a VWAN virtual hub? Can’t find documentation stating this but as vhub is managed by MS, it is expected I guess.
How can one monitor flows in a vhub please? Use case: find flows bypassing the az firewall or NVA.
Thanks !
LikeLike
Yeah, your assessment is correct. At this point you cannot enable VNet Flow Logs in a Virtual WAN hub.
LikeLike
Thanks Jose. Is there a workaround please?
LikeLike
I guess enabling logs in the spokes, or using the info in the firewall logs?
LikeLike
Thanks Jose.
For the use case to find flows bypassing azure firewall in the vwan hub (when routing policies are not in use for example), that would get quickly tricky to identify VNet to VNet flows and cross check they appear (or not) in az fw logs at scale. I feel it would be a great feature to be able to enable flow logs in vwan hub.
LikeLike